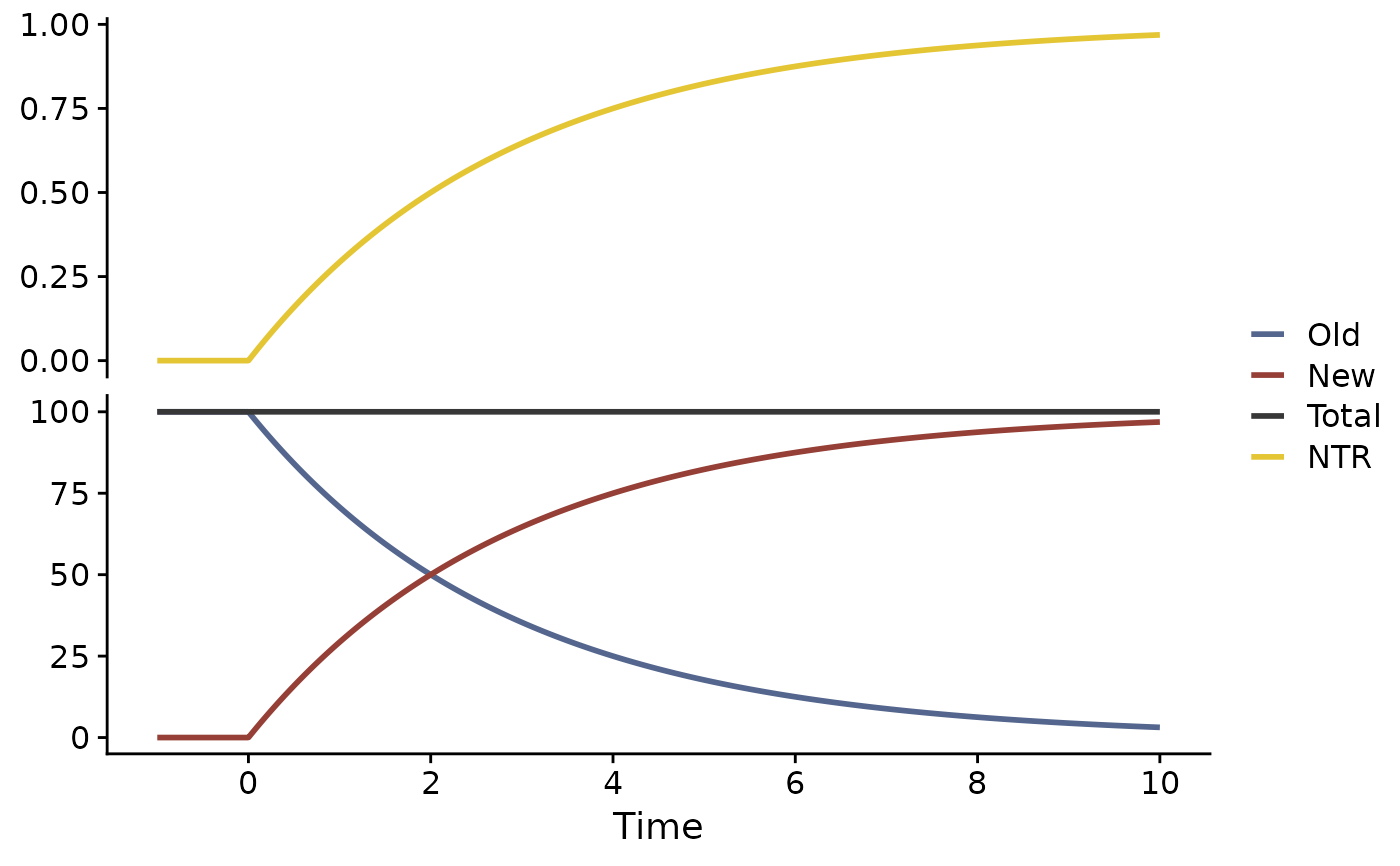
The input data is usually created by SimulateKinetics
Arguments
- sim.df
the input data frame
- ntr
show the ntr?
- old
show old RNA?
- new
show new RNA?
- total
show total RNA?
- line.size
which line size to use
See also
SimulateKinetics for creating the input data frame
Examples
PlotSimulation(SimulateKinetics(hl=2))