Differential expression
Source:vignettes/web/differential-expression.Rmd
differential-expression.RmdOne of the main applications of metabolic RNA labeling is to identify differentially expressed genes upon some perturbation [1]. The main benefit of using metabolic RNA labeling is that short-term changes can be resolved much better as compared to standard RNA-seq, since any changes of transcription that indeed happened are masked to some extent by pre-existing RNA.
To perform differential analyses for data from [2]. These are SLAM-seq data from multiple time points (1h,2h,4h,6h and 20h) after acute depletion of BANP. BANP is a transcriptional activator that binds to unmethylated CGCG motifs in CpG island promoters. All code from this vignette runs within <3 minutes on a modern laptop (Ryzen Pro 7, 1TB Ram).
Loading data and QC
We first load the grandR package and the read the GRAND-SLAM output table directly from zenodo:
banp <- ReadGRAND("https://zenodo.org/record/6976391/files/BANP.tsv.gz",design=c("Cell","Experimental.time","Genotype",Design$dur.4sU,Design$has.4sU,Design$Replicate))Warning: Duplicate gene symbols (n=34, e.g. Ccl27a,Map2k7,Olfr912,St6galnac2,Gm3286,Itgam)
present, making unique!Refer to the Loading data and working
with grandR objects vignette to learn more about how to load data.
Note that sample metadata has been automatically extracted from the
sample names via the design parameter given to
ReadGRAND:
Coldata(banp)| Name | Cell | Genotype | has.4sU | Replicate | duration.4sU | duration.4sU.original | Experimental.time | Experimental.time.original | no4sU | |
|---|---|---|---|---|---|---|---|---|---|---|
| mESC.0h.wt.0h.no4sU.A | mESC.0h.wt.0h.no4sU.A | mESC | wt | no4sU | A | 0.0 | 0h | 0 | 0h | TRUE |
| mESC.0h.wt.0h.no4sU.B | mESC.0h.wt.0h.no4sU.B | mESC | wt | no4sU | B | 0.0 | 0h | 0 | 0h | TRUE |
| mESC.0h.wt.0h.no4sU.C | mESC.0h.wt.0h.no4sU.C | mESC | wt | no4sU | C | 0.0 | 0h | 0 | 0h | TRUE |
| mESC.0h.wt.2h.4sU.A | mESC.0h.wt.2h.4sU.A | mESC | wt | 4sU | A | 2.0 | 2h | 0 | 0h | FALSE |
| mESC.0h.wt.2h.4sU.B | mESC.0h.wt.2h.4sU.B | mESC | wt | 4sU | B | 2.0 | 2h | 0 | 0h | FALSE |
| mESC.0h.wt.2h.4sU.C | mESC.0h.wt.2h.4sU.C | mESC | wt | 4sU | C | 2.0 | 2h | 0 | 0h | FALSE |
| mESC.0h.dTag.2h.4sU.A | mESC.0h.dTag.2h.4sU.A | mESC | dTag | 4sU | A | 2.0 | 2h | 0 | 0h | FALSE |
| mESC.0h.dTag.2h.4sU.B | mESC.0h.dTag.2h.4sU.B | mESC | dTag | 4sU | B | 2.0 | 2h | 0 | 0h | FALSE |
| mESC.1h.dTag.30min.4sU.A | mESC.1h.dTag.30min.4sU.A | mESC | dTag | 4sU | A | 0.5 | 30min | 1 | 1h | FALSE |
| mESC.1h.dTag.30min.4sU.B | mESC.1h.dTag.30min.4sU.B | mESC | dTag | 4sU | B | 0.5 | 30min | 1 | 1h | FALSE |
| mESC.1h.dTag.30min.4sU.C | mESC.1h.dTag.30min.4sU.C | mESC | dTag | 4sU | C | 0.5 | 30min | 1 | 1h | FALSE |
| mESC.2h.dTag.90min.4sU.A | mESC.2h.dTag.90min.4sU.A | mESC | dTag | 4sU | A | 1.5 | 90min | 2 | 2h | FALSE |
| mESC.2h.dTag.90min.4sU.B | mESC.2h.dTag.90min.4sU.B | mESC | dTag | 4sU | B | 1.5 | 90min | 2 | 2h | FALSE |
| mESC.2h.dTag.90min.4sU.C | mESC.2h.dTag.90min.4sU.C | mESC | dTag | 4sU | C | 1.5 | 90min | 2 | 2h | FALSE |
| mESC.4h.dTag.120min.4sU.A | mESC.4h.dTag.120min.4sU.A | mESC | dTag | 4sU | A | 2.0 | 120min | 4 | 4h | FALSE |
| mESC.4h.dTag.120min.4sU.B | mESC.4h.dTag.120min.4sU.B | mESC | dTag | 4sU | B | 2.0 | 120min | 4 | 4h | FALSE |
| mESC.4h.dTag.120min.4sU.C | mESC.4h.dTag.120min.4sU.C | mESC | dTag | 4sU | C | 2.0 | 120min | 4 | 4h | FALSE |
| mESC.6h.dTag.120min.4sU.A | mESC.6h.dTag.120min.4sU.A | mESC | dTag | 4sU | A | 2.0 | 120min | 6 | 6h | FALSE |
| mESC.6h.dTag.120min.4sU.B | mESC.6h.dTag.120min.4sU.B | mESC | dTag | 4sU | B | 2.0 | 120min | 6 | 6h | FALSE |
| mESC.6h.dTag.120min.4sU.C | mESC.6h.dTag.120min.4sU.C | mESC | dTag | 4sU | C | 2.0 | 120min | 6 | 6h | FALSE |
| mESC.20h.dTag.120min.4sU.A | mESC.20h.dTag.120min.4sU.A | mESC | dTag | 4sU | A | 2.0 | 120min | 20 | 20h | FALSE |
| mESC.20h.dTag.120min.4sU.B | mESC.20h.dTag.120min.4sU.B | mESC | dTag | 4sU | B | 2.0 | 120min | 20 | 20h | FALSE |
| mESC.20h.dTag.120min.4sU.C | mESC.20h.dTag.120min.4sU.C | mESC | dTag | 4sU | C | 2.0 | 120min | 20 | 20h | FALSE |
The experimental time column indicates the period of time the sample was treated with the dTAG13 compound that induces acute depletion of BANP within 30 minutes.
By default GRAND-SLAM will report data on all genes (with at least
one mapped read), and ReadGRAND will read all these genes
from the output:
banpgrandR:
Read from https://zenodo.org/record/6976391/files/BANP
24616 genes, 23 samples/cells
Available data slots: count,ntr,alpha,beta
Available analyses:
Available plots:
Default data slot: countThus, we filter to only include genes that have at least 100 reads in at least 11 samples:
banp <- FilterGenes(banp,minval = 100, mincol = 11) # as 100 reads and half of the sample is the default, this is identical to banp <- FilterGenes(banp)
banp
grandR:
Read from https://zenodo.org/record/6976391/files/BANP
11147 genes, 23 samples/cells
Available data slots: count,ntr,alpha,beta
Available analyses:
Available plots:
Default data slot: countThe actual data is available in so-called “data slots”.
ReadGRAND adds the read counts, new to total RNA ratios
(NTRs) and information on the NTR posterior distribution
(alpha,beta).
As a quick quality check, we can inspect a principal component analysis of all samples involved:
PlotPCA(banp) By default, the samples are colored according to the
Condition annotation. Condition has a special
meaning in grandR, not only for PlotPCA, but also for other
analyses (see below). We do not have a condition set (see the Coldata
table above, there is no column named Condition). There are two ways how
the condition can be set:
- Use the keyword “Condition” in the design parameter to
ReadGRAND. Use this, if you have a useful condition as part of your sample names. - Call the
Conditionfunction
Here a useful condition is to combine the genotype, timepoint and 4sU status. We can set this like this (for more information, see the Loading data vignette):
| Name | Cell | Genotype | has.4sU | Replicate | duration.4sU | duration.4sU.original | Experimental.time | Experimental.time.original | no4sU | Condition | |
|---|---|---|---|---|---|---|---|---|---|---|---|
| mESC.0h.wt.0h.no4sU.A | mESC.0h.wt.0h.no4sU.A | mESC | wt | no4sU | A | 0.0 | 0h | 0 | 0h | TRUE | wt.0h.no4sU |
| mESC.0h.wt.0h.no4sU.B | mESC.0h.wt.0h.no4sU.B | mESC | wt | no4sU | B | 0.0 | 0h | 0 | 0h | TRUE | wt.0h.no4sU |
| mESC.0h.wt.0h.no4sU.C | mESC.0h.wt.0h.no4sU.C | mESC | wt | no4sU | C | 0.0 | 0h | 0 | 0h | TRUE | wt.0h.no4sU |
| mESC.0h.wt.2h.4sU.A | mESC.0h.wt.2h.4sU.A | mESC | wt | 4sU | A | 2.0 | 2h | 0 | 0h | FALSE | wt.0h.4sU |
| mESC.0h.wt.2h.4sU.B | mESC.0h.wt.2h.4sU.B | mESC | wt | 4sU | B | 2.0 | 2h | 0 | 0h | FALSE | wt.0h.4sU |
| mESC.0h.wt.2h.4sU.C | mESC.0h.wt.2h.4sU.C | mESC | wt | 4sU | C | 2.0 | 2h | 0 | 0h | FALSE | wt.0h.4sU |
| mESC.0h.dTag.2h.4sU.A | mESC.0h.dTag.2h.4sU.A | mESC | dTag | 4sU | A | 2.0 | 2h | 0 | 0h | FALSE | dTag.0h.4sU |
| mESC.0h.dTag.2h.4sU.B | mESC.0h.dTag.2h.4sU.B | mESC | dTag | 4sU | B | 2.0 | 2h | 0 | 0h | FALSE | dTag.0h.4sU |
| mESC.1h.dTag.30min.4sU.A | mESC.1h.dTag.30min.4sU.A | mESC | dTag | 4sU | A | 0.5 | 30min | 1 | 1h | FALSE | dTag.1h.4sU |
| mESC.1h.dTag.30min.4sU.B | mESC.1h.dTag.30min.4sU.B | mESC | dTag | 4sU | B | 0.5 | 30min | 1 | 1h | FALSE | dTag.1h.4sU |
| mESC.1h.dTag.30min.4sU.C | mESC.1h.dTag.30min.4sU.C | mESC | dTag | 4sU | C | 0.5 | 30min | 1 | 1h | FALSE | dTag.1h.4sU |
| mESC.2h.dTag.90min.4sU.A | mESC.2h.dTag.90min.4sU.A | mESC | dTag | 4sU | A | 1.5 | 90min | 2 | 2h | FALSE | dTag.2h.4sU |
| mESC.2h.dTag.90min.4sU.B | mESC.2h.dTag.90min.4sU.B | mESC | dTag | 4sU | B | 1.5 | 90min | 2 | 2h | FALSE | dTag.2h.4sU |
| mESC.2h.dTag.90min.4sU.C | mESC.2h.dTag.90min.4sU.C | mESC | dTag | 4sU | C | 1.5 | 90min | 2 | 2h | FALSE | dTag.2h.4sU |
| mESC.4h.dTag.120min.4sU.A | mESC.4h.dTag.120min.4sU.A | mESC | dTag | 4sU | A | 2.0 | 120min | 4 | 4h | FALSE | dTag.4h.4sU |
| mESC.4h.dTag.120min.4sU.B | mESC.4h.dTag.120min.4sU.B | mESC | dTag | 4sU | B | 2.0 | 120min | 4 | 4h | FALSE | dTag.4h.4sU |
| mESC.4h.dTag.120min.4sU.C | mESC.4h.dTag.120min.4sU.C | mESC | dTag | 4sU | C | 2.0 | 120min | 4 | 4h | FALSE | dTag.4h.4sU |
| mESC.6h.dTag.120min.4sU.A | mESC.6h.dTag.120min.4sU.A | mESC | dTag | 4sU | A | 2.0 | 120min | 6 | 6h | FALSE | dTag.6h.4sU |
| mESC.6h.dTag.120min.4sU.B | mESC.6h.dTag.120min.4sU.B | mESC | dTag | 4sU | B | 2.0 | 120min | 6 | 6h | FALSE | dTag.6h.4sU |
| mESC.6h.dTag.120min.4sU.C | mESC.6h.dTag.120min.4sU.C | mESC | dTag | 4sU | C | 2.0 | 120min | 6 | 6h | FALSE | dTag.6h.4sU |
| mESC.20h.dTag.120min.4sU.A | mESC.20h.dTag.120min.4sU.A | mESC | dTag | 4sU | A | 2.0 | 120min | 20 | 20h | FALSE | dTag.20h.4sU |
| mESC.20h.dTag.120min.4sU.B | mESC.20h.dTag.120min.4sU.B | mESC | dTag | 4sU | B | 2.0 | 120min | 20 | 20h | FALSE | dTag.20h.4sU |
| mESC.20h.dTag.120min.4sU.C | mESC.20h.dTag.120min.4sU.C | mESC | dTag | 4sU | C | 2.0 | 120min | 20 | 20h | FALSE | dTag.20h.4sU |
PlotPCA(banp)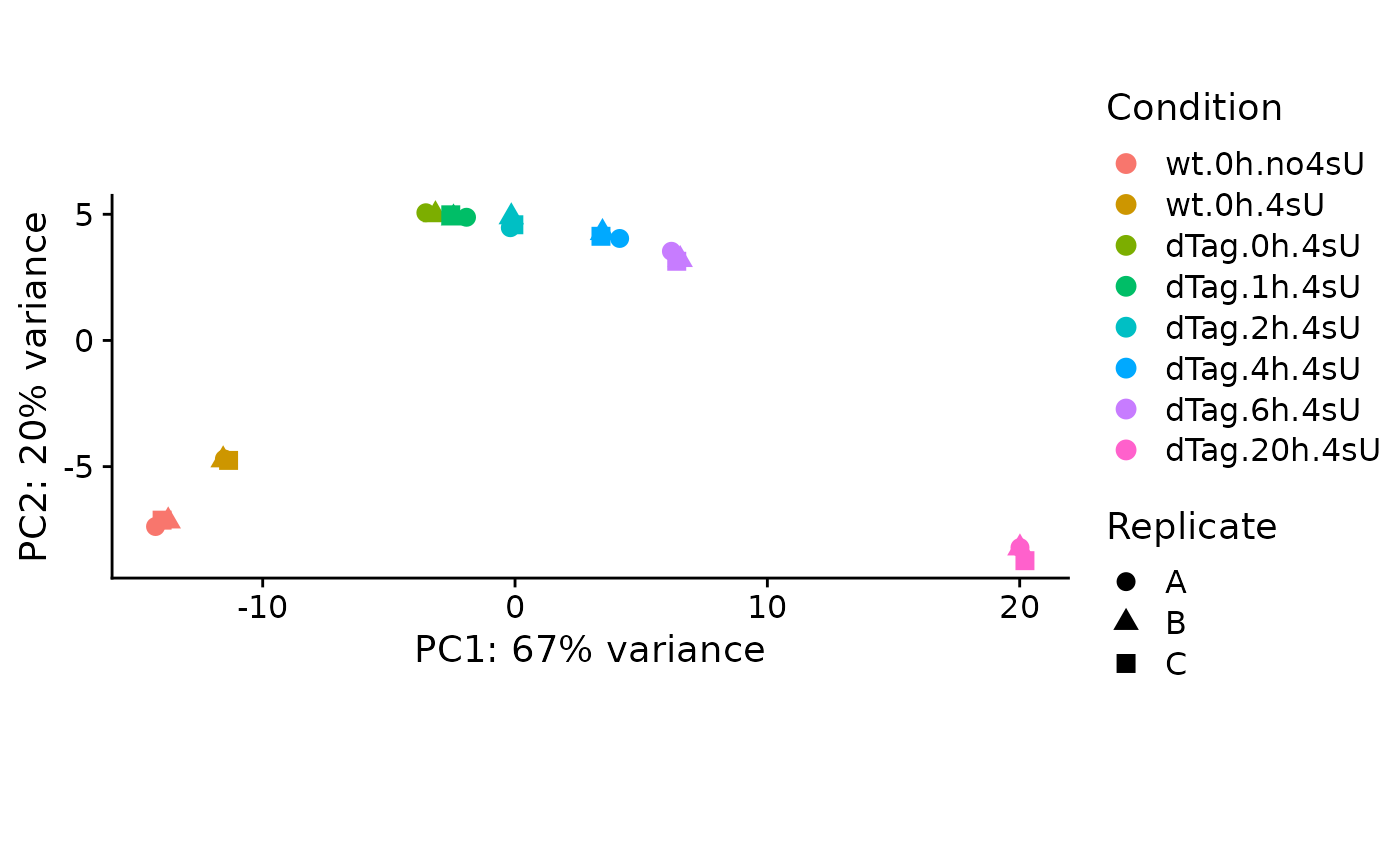
We see that (i) 4sU treatment had an effect on total RNA levels (there is a clear difference between no4sU and 4sU for wt), and that (ii) inserting the degron tag also had an effect (there is a clear difference between wt and dTag.0h, the latter is a sample treated with 4sU for 2h, but was not treated with dTAG13).
Before we can investigate these effects, we need to learn how to
performing pairwise differential expression analysis in grandR. Such
pairwise analyses are based on so-called “contrast matrices”, which can
conveniently be constructed by using the GetContrasts
function:
GetContrasts(banp)| wt.0h.4sU vs dTag.0h.4sU | wt.0h.4sU vs dTag.1h.4sU | wt.0h.4sU vs dTag.2h.4sU | wt.0h.4sU vs dTag.4h.4sU | wt.0h.4sU vs dTag.6h.4sU | wt.0h.4sU vs dTag.20h.4sU | dTag.0h.4sU vs dTag.1h.4sU | dTag.0h.4sU vs dTag.2h.4sU | dTag.0h.4sU vs dTag.4h.4sU | dTag.0h.4sU vs dTag.6h.4sU | dTag.0h.4sU vs dTag.20h.4sU | dTag.1h.4sU vs dTag.2h.4sU | dTag.1h.4sU vs dTag.4h.4sU | dTag.1h.4sU vs dTag.6h.4sU | dTag.1h.4sU vs dTag.20h.4sU | dTag.2h.4sU vs dTag.4h.4sU | dTag.2h.4sU vs dTag.6h.4sU | dTag.2h.4sU vs dTag.20h.4sU | dTag.4h.4sU vs dTag.6h.4sU | dTag.4h.4sU vs dTag.20h.4sU | dTag.6h.4sU vs dTag.20h.4sU | |
|---|---|---|---|---|---|---|---|---|---|---|---|---|---|---|---|---|---|---|---|---|---|
| mESC.0h.wt.0h.no4sU.A | 0 | 0 | 0 | 0 | 0 | 0 | 0 | 0 | 0 | 0 | 0 | 0 | 0 | 0 | 0 | 0 | 0 | 0 | 0 | 0 | 0 |
| mESC.0h.wt.0h.no4sU.B | 0 | 0 | 0 | 0 | 0 | 0 | 0 | 0 | 0 | 0 | 0 | 0 | 0 | 0 | 0 | 0 | 0 | 0 | 0 | 0 | 0 |
| mESC.0h.wt.0h.no4sU.C | 0 | 0 | 0 | 0 | 0 | 0 | 0 | 0 | 0 | 0 | 0 | 0 | 0 | 0 | 0 | 0 | 0 | 0 | 0 | 0 | 0 |
| mESC.0h.wt.2h.4sU.A | 1 | 1 | 1 | 1 | 1 | 1 | 0 | 0 | 0 | 0 | 0 | 0 | 0 | 0 | 0 | 0 | 0 | 0 | 0 | 0 | 0 |
| mESC.0h.wt.2h.4sU.B | 1 | 1 | 1 | 1 | 1 | 1 | 0 | 0 | 0 | 0 | 0 | 0 | 0 | 0 | 0 | 0 | 0 | 0 | 0 | 0 | 0 |
| mESC.0h.wt.2h.4sU.C | 1 | 1 | 1 | 1 | 1 | 1 | 0 | 0 | 0 | 0 | 0 | 0 | 0 | 0 | 0 | 0 | 0 | 0 | 0 | 0 | 0 |
| mESC.0h.dTag.2h.4sU.A | -1 | 0 | 0 | 0 | 0 | 0 | 1 | 1 | 1 | 1 | 1 | 0 | 0 | 0 | 0 | 0 | 0 | 0 | 0 | 0 | 0 |
| mESC.0h.dTag.2h.4sU.B | -1 | 0 | 0 | 0 | 0 | 0 | 1 | 1 | 1 | 1 | 1 | 0 | 0 | 0 | 0 | 0 | 0 | 0 | 0 | 0 | 0 |
| mESC.1h.dTag.30min.4sU.A | 0 | -1 | 0 | 0 | 0 | 0 | -1 | 0 | 0 | 0 | 0 | 1 | 1 | 1 | 1 | 0 | 0 | 0 | 0 | 0 | 0 |
| mESC.1h.dTag.30min.4sU.B | 0 | -1 | 0 | 0 | 0 | 0 | -1 | 0 | 0 | 0 | 0 | 1 | 1 | 1 | 1 | 0 | 0 | 0 | 0 | 0 | 0 |
| mESC.1h.dTag.30min.4sU.C | 0 | -1 | 0 | 0 | 0 | 0 | -1 | 0 | 0 | 0 | 0 | 1 | 1 | 1 | 1 | 0 | 0 | 0 | 0 | 0 | 0 |
| mESC.2h.dTag.90min.4sU.A | 0 | 0 | -1 | 0 | 0 | 0 | 0 | -1 | 0 | 0 | 0 | -1 | 0 | 0 | 0 | 1 | 1 | 1 | 0 | 0 | 0 |
| mESC.2h.dTag.90min.4sU.B | 0 | 0 | -1 | 0 | 0 | 0 | 0 | -1 | 0 | 0 | 0 | -1 | 0 | 0 | 0 | 1 | 1 | 1 | 0 | 0 | 0 |
| mESC.2h.dTag.90min.4sU.C | 0 | 0 | -1 | 0 | 0 | 0 | 0 | -1 | 0 | 0 | 0 | -1 | 0 | 0 | 0 | 1 | 1 | 1 | 0 | 0 | 0 |
| mESC.4h.dTag.120min.4sU.A | 0 | 0 | 0 | -1 | 0 | 0 | 0 | 0 | -1 | 0 | 0 | 0 | -1 | 0 | 0 | -1 | 0 | 0 | 1 | 1 | 0 |
| mESC.4h.dTag.120min.4sU.B | 0 | 0 | 0 | -1 | 0 | 0 | 0 | 0 | -1 | 0 | 0 | 0 | -1 | 0 | 0 | -1 | 0 | 0 | 1 | 1 | 0 |
| mESC.4h.dTag.120min.4sU.C | 0 | 0 | 0 | -1 | 0 | 0 | 0 | 0 | -1 | 0 | 0 | 0 | -1 | 0 | 0 | -1 | 0 | 0 | 1 | 1 | 0 |
| mESC.6h.dTag.120min.4sU.A | 0 | 0 | 0 | 0 | -1 | 0 | 0 | 0 | 0 | -1 | 0 | 0 | 0 | -1 | 0 | 0 | -1 | 0 | -1 | 0 | 1 |
| mESC.6h.dTag.120min.4sU.B | 0 | 0 | 0 | 0 | -1 | 0 | 0 | 0 | 0 | -1 | 0 | 0 | 0 | -1 | 0 | 0 | -1 | 0 | -1 | 0 | 1 |
| mESC.6h.dTag.120min.4sU.C | 0 | 0 | 0 | 0 | -1 | 0 | 0 | 0 | 0 | -1 | 0 | 0 | 0 | -1 | 0 | 0 | -1 | 0 | -1 | 0 | 1 |
| mESC.20h.dTag.120min.4sU.A | 0 | 0 | 0 | 0 | 0 | -1 | 0 | 0 | 0 | 0 | -1 | 0 | 0 | 0 | -1 | 0 | 0 | -1 | 0 | -1 | -1 |
| mESC.20h.dTag.120min.4sU.B | 0 | 0 | 0 | 0 | 0 | -1 | 0 | 0 | 0 | 0 | -1 | 0 | 0 | 0 | -1 | 0 | 0 | -1 | 0 | -1 | -1 |
| mESC.20h.dTag.120min.4sU.C | 0 | 0 | 0 | 0 | 0 | -1 | 0 | 0 | 0 | 0 | -1 | 0 | 0 | 0 | -1 | 0 | 0 | -1 | 0 | -1 | -1 |
Each column of the contrast matrix defines a single pairwise comparison: Samples with 0 are left out, and samples with 1 are compared vs samples with -1 (e.g. if log2 fold change are computed, comparing A vs B means log2(A/B)).
Without specifying any parameters, GetContrasts will
discard no4sU samples, and all pairwise comparisons of the remaining
conditions (here there are 7 conditions having 4sU, i.e. 21 pairwise
comparisons) are generated. This behavior can be changed by the
contrasts parameter.
This parameter is a vector of length 1, 2 or 3. The first element always is a name of a column in the Coldata table, the second and third (if given) need to be values of this column. If only the column is given, all pairwise comparisons are generated (i.e. this is the default behavior shown above, for columns “Condition”):
GetContrasts(banp,contrast = c("Condition"))| wt.0h.4sU vs dTag.0h.4sU | wt.0h.4sU vs dTag.1h.4sU | wt.0h.4sU vs dTag.2h.4sU | wt.0h.4sU vs dTag.4h.4sU | wt.0h.4sU vs dTag.6h.4sU | wt.0h.4sU vs dTag.20h.4sU | dTag.0h.4sU vs dTag.1h.4sU | dTag.0h.4sU vs dTag.2h.4sU | dTag.0h.4sU vs dTag.4h.4sU | dTag.0h.4sU vs dTag.6h.4sU | dTag.0h.4sU vs dTag.20h.4sU | dTag.1h.4sU vs dTag.2h.4sU | dTag.1h.4sU vs dTag.4h.4sU | dTag.1h.4sU vs dTag.6h.4sU | dTag.1h.4sU vs dTag.20h.4sU | dTag.2h.4sU vs dTag.4h.4sU | dTag.2h.4sU vs dTag.6h.4sU | dTag.2h.4sU vs dTag.20h.4sU | dTag.4h.4sU vs dTag.6h.4sU | dTag.4h.4sU vs dTag.20h.4sU | dTag.6h.4sU vs dTag.20h.4sU | |
|---|---|---|---|---|---|---|---|---|---|---|---|---|---|---|---|---|---|---|---|---|---|
| mESC.0h.wt.0h.no4sU.A | 0 | 0 | 0 | 0 | 0 | 0 | 0 | 0 | 0 | 0 | 0 | 0 | 0 | 0 | 0 | 0 | 0 | 0 | 0 | 0 | 0 |
| mESC.0h.wt.0h.no4sU.B | 0 | 0 | 0 | 0 | 0 | 0 | 0 | 0 | 0 | 0 | 0 | 0 | 0 | 0 | 0 | 0 | 0 | 0 | 0 | 0 | 0 |
| mESC.0h.wt.0h.no4sU.C | 0 | 0 | 0 | 0 | 0 | 0 | 0 | 0 | 0 | 0 | 0 | 0 | 0 | 0 | 0 | 0 | 0 | 0 | 0 | 0 | 0 |
| mESC.0h.wt.2h.4sU.A | 1 | 1 | 1 | 1 | 1 | 1 | 0 | 0 | 0 | 0 | 0 | 0 | 0 | 0 | 0 | 0 | 0 | 0 | 0 | 0 | 0 |
| mESC.0h.wt.2h.4sU.B | 1 | 1 | 1 | 1 | 1 | 1 | 0 | 0 | 0 | 0 | 0 | 0 | 0 | 0 | 0 | 0 | 0 | 0 | 0 | 0 | 0 |
| mESC.0h.wt.2h.4sU.C | 1 | 1 | 1 | 1 | 1 | 1 | 0 | 0 | 0 | 0 | 0 | 0 | 0 | 0 | 0 | 0 | 0 | 0 | 0 | 0 | 0 |
| mESC.0h.dTag.2h.4sU.A | -1 | 0 | 0 | 0 | 0 | 0 | 1 | 1 | 1 | 1 | 1 | 0 | 0 | 0 | 0 | 0 | 0 | 0 | 0 | 0 | 0 |
| mESC.0h.dTag.2h.4sU.B | -1 | 0 | 0 | 0 | 0 | 0 | 1 | 1 | 1 | 1 | 1 | 0 | 0 | 0 | 0 | 0 | 0 | 0 | 0 | 0 | 0 |
| mESC.1h.dTag.30min.4sU.A | 0 | -1 | 0 | 0 | 0 | 0 | -1 | 0 | 0 | 0 | 0 | 1 | 1 | 1 | 1 | 0 | 0 | 0 | 0 | 0 | 0 |
| mESC.1h.dTag.30min.4sU.B | 0 | -1 | 0 | 0 | 0 | 0 | -1 | 0 | 0 | 0 | 0 | 1 | 1 | 1 | 1 | 0 | 0 | 0 | 0 | 0 | 0 |
| mESC.1h.dTag.30min.4sU.C | 0 | -1 | 0 | 0 | 0 | 0 | -1 | 0 | 0 | 0 | 0 | 1 | 1 | 1 | 1 | 0 | 0 | 0 | 0 | 0 | 0 |
| mESC.2h.dTag.90min.4sU.A | 0 | 0 | -1 | 0 | 0 | 0 | 0 | -1 | 0 | 0 | 0 | -1 | 0 | 0 | 0 | 1 | 1 | 1 | 0 | 0 | 0 |
| mESC.2h.dTag.90min.4sU.B | 0 | 0 | -1 | 0 | 0 | 0 | 0 | -1 | 0 | 0 | 0 | -1 | 0 | 0 | 0 | 1 | 1 | 1 | 0 | 0 | 0 |
| mESC.2h.dTag.90min.4sU.C | 0 | 0 | -1 | 0 | 0 | 0 | 0 | -1 | 0 | 0 | 0 | -1 | 0 | 0 | 0 | 1 | 1 | 1 | 0 | 0 | 0 |
| mESC.4h.dTag.120min.4sU.A | 0 | 0 | 0 | -1 | 0 | 0 | 0 | 0 | -1 | 0 | 0 | 0 | -1 | 0 | 0 | -1 | 0 | 0 | 1 | 1 | 0 |
| mESC.4h.dTag.120min.4sU.B | 0 | 0 | 0 | -1 | 0 | 0 | 0 | 0 | -1 | 0 | 0 | 0 | -1 | 0 | 0 | -1 | 0 | 0 | 1 | 1 | 0 |
| mESC.4h.dTag.120min.4sU.C | 0 | 0 | 0 | -1 | 0 | 0 | 0 | 0 | -1 | 0 | 0 | 0 | -1 | 0 | 0 | -1 | 0 | 0 | 1 | 1 | 0 |
| mESC.6h.dTag.120min.4sU.A | 0 | 0 | 0 | 0 | -1 | 0 | 0 | 0 | 0 | -1 | 0 | 0 | 0 | -1 | 0 | 0 | -1 | 0 | -1 | 0 | 1 |
| mESC.6h.dTag.120min.4sU.B | 0 | 0 | 0 | 0 | -1 | 0 | 0 | 0 | 0 | -1 | 0 | 0 | 0 | -1 | 0 | 0 | -1 | 0 | -1 | 0 | 1 |
| mESC.6h.dTag.120min.4sU.C | 0 | 0 | 0 | 0 | -1 | 0 | 0 | 0 | 0 | -1 | 0 | 0 | 0 | -1 | 0 | 0 | -1 | 0 | -1 | 0 | 1 |
| mESC.20h.dTag.120min.4sU.A | 0 | 0 | 0 | 0 | 0 | -1 | 0 | 0 | 0 | 0 | -1 | 0 | 0 | 0 | -1 | 0 | 0 | -1 | 0 | -1 | -1 |
| mESC.20h.dTag.120min.4sU.B | 0 | 0 | 0 | 0 | 0 | -1 | 0 | 0 | 0 | 0 | -1 | 0 | 0 | 0 | -1 | 0 | 0 | -1 | 0 | -1 | -1 |
| mESC.20h.dTag.120min.4sU.C | 0 | 0 | 0 | 0 | 0 | -1 | 0 | 0 | 0 | 0 | -1 | 0 | 0 | 0 | -1 | 0 | 0 | -1 | 0 | -1 | -1 |
If one value is given, all pairwise comparisons with this as reference are created (i.e., if A is given, all X vs A for all other values X):
GetContrasts(banp,contrast = c("Condition","dTag.0h.4sU"))| wt.0h.4sU vs dTag.0h.4sU | dTag.1h.4sU vs dTag.0h.4sU | dTag.2h.4sU vs dTag.0h.4sU | dTag.4h.4sU vs dTag.0h.4sU | dTag.6h.4sU vs dTag.0h.4sU | dTag.20h.4sU vs dTag.0h.4sU | |
|---|---|---|---|---|---|---|
| mESC.0h.wt.0h.no4sU.A | 0 | 0 | 0 | 0 | 0 | 0 |
| mESC.0h.wt.0h.no4sU.B | 0 | 0 | 0 | 0 | 0 | 0 |
| mESC.0h.wt.0h.no4sU.C | 0 | 0 | 0 | 0 | 0 | 0 |
| mESC.0h.wt.2h.4sU.A | 1 | 0 | 0 | 0 | 0 | 0 |
| mESC.0h.wt.2h.4sU.B | 1 | 0 | 0 | 0 | 0 | 0 |
| mESC.0h.wt.2h.4sU.C | 1 | 0 | 0 | 0 | 0 | 0 |
| mESC.0h.dTag.2h.4sU.A | -1 | -1 | -1 | -1 | -1 | -1 |
| mESC.0h.dTag.2h.4sU.B | -1 | -1 | -1 | -1 | -1 | -1 |
| mESC.1h.dTag.30min.4sU.A | 0 | 1 | 0 | 0 | 0 | 0 |
| mESC.1h.dTag.30min.4sU.B | 0 | 1 | 0 | 0 | 0 | 0 |
| mESC.1h.dTag.30min.4sU.C | 0 | 1 | 0 | 0 | 0 | 0 |
| mESC.2h.dTag.90min.4sU.A | 0 | 0 | 1 | 0 | 0 | 0 |
| mESC.2h.dTag.90min.4sU.B | 0 | 0 | 1 | 0 | 0 | 0 |
| mESC.2h.dTag.90min.4sU.C | 0 | 0 | 1 | 0 | 0 | 0 |
| mESC.4h.dTag.120min.4sU.A | 0 | 0 | 0 | 1 | 0 | 0 |
| mESC.4h.dTag.120min.4sU.B | 0 | 0 | 0 | 1 | 0 | 0 |
| mESC.4h.dTag.120min.4sU.C | 0 | 0 | 0 | 1 | 0 | 0 |
| mESC.6h.dTag.120min.4sU.A | 0 | 0 | 0 | 0 | 1 | 0 |
| mESC.6h.dTag.120min.4sU.B | 0 | 0 | 0 | 0 | 1 | 0 |
| mESC.6h.dTag.120min.4sU.C | 0 | 0 | 0 | 0 | 1 | 0 |
| mESC.20h.dTag.120min.4sU.A | 0 | 0 | 0 | 0 | 0 | 1 |
| mESC.20h.dTag.120min.4sU.B | 0 | 0 | 0 | 0 | 0 | 1 |
| mESC.20h.dTag.120min.4sU.C | 0 | 0 | 0 | 0 | 0 | 1 |
If two values are given, a single pairwise comparison is created:
GetContrasts(banp,contrast = c("Condition","dTag.2h.4sU","dTag.0h.4sU"))| dTag.2h.4sU vs dTag.0h.4sU | |
|---|---|
| mESC.0h.wt.0h.no4sU.A | 0 |
| mESC.0h.wt.0h.no4sU.B | 0 |
| mESC.0h.wt.0h.no4sU.C | 0 |
| mESC.0h.wt.2h.4sU.A | 0 |
| mESC.0h.wt.2h.4sU.B | 0 |
| mESC.0h.wt.2h.4sU.C | 0 |
| mESC.0h.dTag.2h.4sU.A | -1 |
| mESC.0h.dTag.2h.4sU.B | -1 |
| mESC.1h.dTag.30min.4sU.A | 0 |
| mESC.1h.dTag.30min.4sU.B | 0 |
| mESC.1h.dTag.30min.4sU.C | 0 |
| mESC.2h.dTag.90min.4sU.A | 1 |
| mESC.2h.dTag.90min.4sU.B | 1 |
| mESC.2h.dTag.90min.4sU.C | 1 |
| mESC.4h.dTag.120min.4sU.A | 0 |
| mESC.4h.dTag.120min.4sU.B | 0 |
| mESC.4h.dTag.120min.4sU.C | 0 |
| mESC.6h.dTag.120min.4sU.A | 0 |
| mESC.6h.dTag.120min.4sU.B | 0 |
| mESC.6h.dTag.120min.4sU.C | 0 |
| mESC.20h.dTag.120min.4sU.A | 0 |
| mESC.20h.dTag.120min.4sU.B | 0 |
| mESC.20h.dTag.120min.4sU.C | 0 |
It is possible to restrict the samples to be used by defining the
columns parameter (samples for bulk experiments or cells
for single cell experiments are jointly called “columns” in grandR):
GetContrasts(banp,contrast = c("Condition","dTag.0h.4sU"),columns = Genotype=="dTag")| dTag.1h.4sU vs dTag.0h.4sU | dTag.2h.4sU vs dTag.0h.4sU | dTag.4h.4sU vs dTag.0h.4sU | dTag.6h.4sU vs dTag.0h.4sU | dTag.20h.4sU vs dTag.0h.4sU | |
|---|---|---|---|---|---|
| mESC.0h.wt.0h.no4sU.A | 0 | 0 | 0 | 0 | 0 |
| mESC.0h.wt.0h.no4sU.B | 0 | 0 | 0 | 0 | 0 |
| mESC.0h.wt.0h.no4sU.C | 0 | 0 | 0 | 0 | 0 |
| mESC.0h.wt.2h.4sU.A | 0 | 0 | 0 | 0 | 0 |
| mESC.0h.wt.2h.4sU.B | 0 | 0 | 0 | 0 | 0 |
| mESC.0h.wt.2h.4sU.C | 0 | 0 | 0 | 0 | 0 |
| mESC.0h.dTag.2h.4sU.A | -1 | -1 | -1 | -1 | -1 |
| mESC.0h.dTag.2h.4sU.B | -1 | -1 | -1 | -1 | -1 |
| mESC.1h.dTag.30min.4sU.A | 1 | 0 | 0 | 0 | 0 |
| mESC.1h.dTag.30min.4sU.B | 1 | 0 | 0 | 0 | 0 |
| mESC.1h.dTag.30min.4sU.C | 1 | 0 | 0 | 0 | 0 |
| mESC.2h.dTag.90min.4sU.A | 0 | 1 | 0 | 0 | 0 |
| mESC.2h.dTag.90min.4sU.B | 0 | 1 | 0 | 0 | 0 |
| mESC.2h.dTag.90min.4sU.C | 0 | 1 | 0 | 0 | 0 |
| mESC.4h.dTag.120min.4sU.A | 0 | 0 | 1 | 0 | 0 |
| mESC.4h.dTag.120min.4sU.B | 0 | 0 | 1 | 0 | 0 |
| mESC.4h.dTag.120min.4sU.C | 0 | 0 | 1 | 0 | 0 |
| mESC.6h.dTag.120min.4sU.A | 0 | 0 | 0 | 1 | 0 |
| mESC.6h.dTag.120min.4sU.B | 0 | 0 | 0 | 1 | 0 |
| mESC.6h.dTag.120min.4sU.C | 0 | 0 | 0 | 1 | 0 |
| mESC.20h.dTag.120min.4sU.A | 0 | 0 | 0 | 0 | 1 |
| mESC.20h.dTag.120min.4sU.B | 0 | 0 | 0 | 0 | 1 |
| mESC.20h.dTag.120min.4sU.C | 0 | 0 | 0 | 0 | 1 |
# note that you can use names from the Coldata table here to build an expressionIf you want to perform comparisons involving no4sU samples (which
usually are control samples only), you can do this by setting the
no4sU parameter to TRUE:
GetContrasts(banp,contrast=c("has.4sU","4sU","no4sU"),columns=Genotype=="wt",no4sU = TRUE)| 4sU vs no4sU | |
|---|---|
| mESC.0h.wt.0h.no4sU.A | -1 |
| mESC.0h.wt.0h.no4sU.B | -1 |
| mESC.0h.wt.0h.no4sU.C | -1 |
| mESC.0h.wt.2h.4sU.A | 1 |
| mESC.0h.wt.2h.4sU.B | 1 |
| mESC.0h.wt.2h.4sU.C | 1 |
| mESC.0h.dTag.2h.4sU.A | 0 |
| mESC.0h.dTag.2h.4sU.B | 0 |
| mESC.1h.dTag.30min.4sU.A | 0 |
| mESC.1h.dTag.30min.4sU.B | 0 |
| mESC.1h.dTag.30min.4sU.C | 0 |
| mESC.2h.dTag.90min.4sU.A | 0 |
| mESC.2h.dTag.90min.4sU.B | 0 |
| mESC.2h.dTag.90min.4sU.C | 0 |
| mESC.4h.dTag.120min.4sU.A | 0 |
| mESC.4h.dTag.120min.4sU.B | 0 |
| mESC.4h.dTag.120min.4sU.C | 0 |
| mESC.6h.dTag.120min.4sU.A | 0 |
| mESC.6h.dTag.120min.4sU.B | 0 |
| mESC.6h.dTag.120min.4sU.C | 0 |
| mESC.20h.dTag.120min.4sU.A | 0 |
| mESC.20h.dTag.120min.4sU.B | 0 |
| mESC.20h.dTag.120min.4sU.C | 0 |
Sometimes, you want to perform comparisons only among samples from specific groups of samples. This is useful e.g. if you want to compare treatment vs control under different conditions (e.g. cell types), or perform paired pairwise tests (if replicates A, B and C were paired, like in the following example):
GetContrasts(banp,contrast=c("has.4sU","4sU","no4sU"),columns=Genotype=="wt",no4sU = TRUE,
group="Replicate")| 4sU vs no4sU.A | 4sU vs no4sU.B | 4sU vs no4sU.C | |
|---|---|---|---|
| mESC.0h.wt.0h.no4sU.A | -1 | 0 | 0 |
| mESC.0h.wt.0h.no4sU.B | 0 | -1 | 0 |
| mESC.0h.wt.0h.no4sU.C | 0 | 0 | -1 |
| mESC.0h.wt.2h.4sU.A | 1 | 0 | 0 |
| mESC.0h.wt.2h.4sU.B | 0 | 1 | 0 |
| mESC.0h.wt.2h.4sU.C | 0 | 0 | 1 |
| mESC.0h.dTag.2h.4sU.A | 0 | 0 | 0 |
| mESC.0h.dTag.2h.4sU.B | 0 | 0 | 0 |
| mESC.1h.dTag.30min.4sU.A | 0 | 0 | 0 |
| mESC.1h.dTag.30min.4sU.B | 0 | 0 | 0 |
| mESC.1h.dTag.30min.4sU.C | 0 | 0 | 0 |
| mESC.2h.dTag.90min.4sU.A | 0 | 0 | 0 |
| mESC.2h.dTag.90min.4sU.B | 0 | 0 | 0 |
| mESC.2h.dTag.90min.4sU.C | 0 | 0 | 0 |
| mESC.4h.dTag.120min.4sU.A | 0 | 0 | 0 |
| mESC.4h.dTag.120min.4sU.B | 0 | 0 | 0 |
| mESC.4h.dTag.120min.4sU.C | 0 | 0 | 0 |
| mESC.6h.dTag.120min.4sU.A | 0 | 0 | 0 |
| mESC.6h.dTag.120min.4sU.B | 0 | 0 | 0 |
| mESC.6h.dTag.120min.4sU.C | 0 | 0 | 0 |
| mESC.20h.dTag.120min.4sU.A | 0 | 0 | 0 |
| mESC.20h.dTag.120min.4sU.B | 0 | 0 | 0 |
| mESC.20h.dTag.120min.4sU.C | 0 | 0 | 0 |
Finally, if you are not happy with the column names (which end up as the names for analysis tables), you can change this as well:
GetContrasts(banp,contrast=c("has.4sU","4sU","no4sU"),columns=Genotype=="wt",no4sU = TRUE,
group="Replicate",name.format = "$GRP")| A | B | C | |
|---|---|---|---|
| mESC.0h.wt.0h.no4sU.A | -1 | 0 | 0 |
| mESC.0h.wt.0h.no4sU.B | 0 | -1 | 0 |
| mESC.0h.wt.0h.no4sU.C | 0 | 0 | -1 |
| mESC.0h.wt.2h.4sU.A | 1 | 0 | 0 |
| mESC.0h.wt.2h.4sU.B | 0 | 1 | 0 |
| mESC.0h.wt.2h.4sU.C | 0 | 0 | 1 |
| mESC.0h.dTag.2h.4sU.A | 0 | 0 | 0 |
| mESC.0h.dTag.2h.4sU.B | 0 | 0 | 0 |
| mESC.1h.dTag.30min.4sU.A | 0 | 0 | 0 |
| mESC.1h.dTag.30min.4sU.B | 0 | 0 | 0 |
| mESC.1h.dTag.30min.4sU.C | 0 | 0 | 0 |
| mESC.2h.dTag.90min.4sU.A | 0 | 0 | 0 |
| mESC.2h.dTag.90min.4sU.B | 0 | 0 | 0 |
| mESC.2h.dTag.90min.4sU.C | 0 | 0 | 0 |
| mESC.4h.dTag.120min.4sU.A | 0 | 0 | 0 |
| mESC.4h.dTag.120min.4sU.B | 0 | 0 | 0 |
| mESC.4h.dTag.120min.4sU.C | 0 | 0 | 0 |
| mESC.6h.dTag.120min.4sU.A | 0 | 0 | 0 |
| mESC.6h.dTag.120min.4sU.B | 0 | 0 | 0 |
| mESC.6h.dTag.120min.4sU.C | 0 | 0 | 0 |
| mESC.20h.dTag.120min.4sU.A | 0 | 0 | 0 |
| mESC.20h.dTag.120min.4sU.B | 0 | 0 | 0 |
| mESC.20h.dTag.120min.4sU.C | 0 | 0 | 0 |
Differential analysis of 4sU treatment and dTag
Now we can investigate the two unwanted effects mentioned above using differential analysis using the lfc package [3] and DESeq2:
contrasts <- cbind(
  GetContrasts(banp,contrast=c("has.4sU","4sU","no4sU"),
               columns=Genotype=="wt",no4sU = TRUE,name.format = "4sU effect"),
  # set up the contrast matrix for compare wt.2h.4sU vs wt.2h.no4sU, as above
  GetContrasts(banp,contrast=c("Genotype","dTag","wt"),
               columns=Experimental.time==0,name.format="dTag effect")
  # set up the contrast matrix for compare dTag vs wt without dTAG13 treatment
)
banp <- LFC(banp,name.prefix = "QC",contrasts=contrasts, compute.M = FALSE)
banp
grandR:
Read from https://zenodo.org/record/6976391/files/BANP
11147 genes, 23 samples/cells
Available data slots: count,ntr,alpha,beta
Available analyses: QC.4sU effect,QC.dTag effect
Available plots:
Default data slot: countAs you see, now we have two analyses added to our grandR object. We
can use PlotScatter to directly plot them:
PlotScatter(banp,xlim=c(-2,2),ylim=c(-2,2))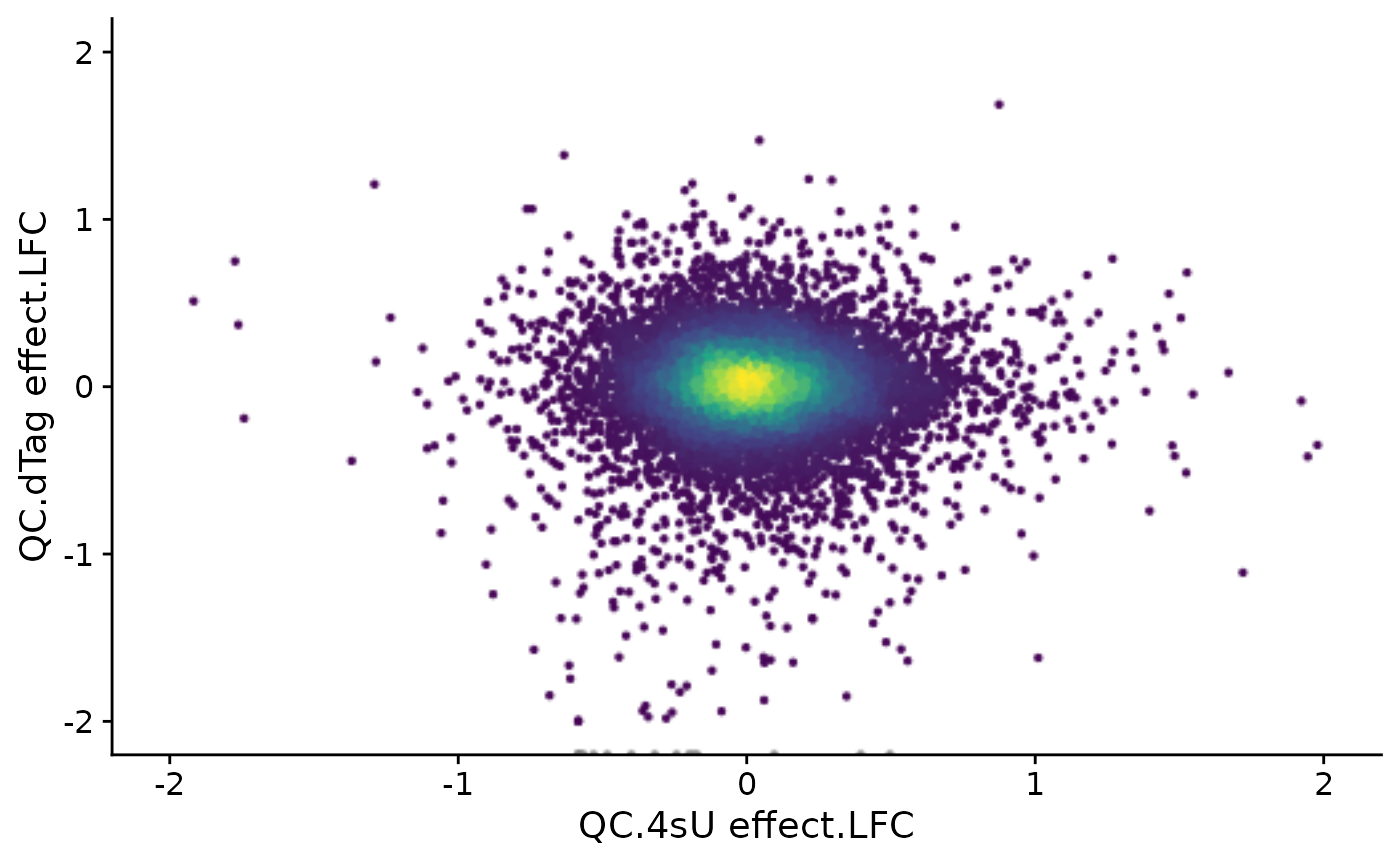
This works since there are only two analysis values overall that are stored in the object (this is also why we used the compute.M = FALSE parameter above; by default, LFC() also computes the mean (M) expression value in log10 space to enable generating MA plots):
Analyses(banp,description = TRUE)$`QC.4sU effect`
[1] "LFC"
$`QC.dTag effect`
[1] "LFC"We see that there are quite some effects for both pairwise comparison.
Differential analysis of 4sU treatment
To focus on the 4sU effect, we first create 4sU dropout plots. 4sU labeling can have impact on transcription before cell viability suffers. Such an effect would be observable in these plots by a substantial negative correlation, i.e. genes with high NTR (which are to the right), should tend to be downregulated in the 4sU labeled sample vs an equivalent 4sU naive sample. It is important that these analyses are only done by comparing biologically equivalent samples (and not on the SARS infected samples here, as the no4sU sample is from 3h post infection, and all others are later).
Condition(banp)="Genotype"  # Plot4sUDropoutRankAll will use all no4sU samples within the same Condition as reference
Plot4sUDropoutRankAll(banp)
$mESC.0h.wt.2h.4sU.A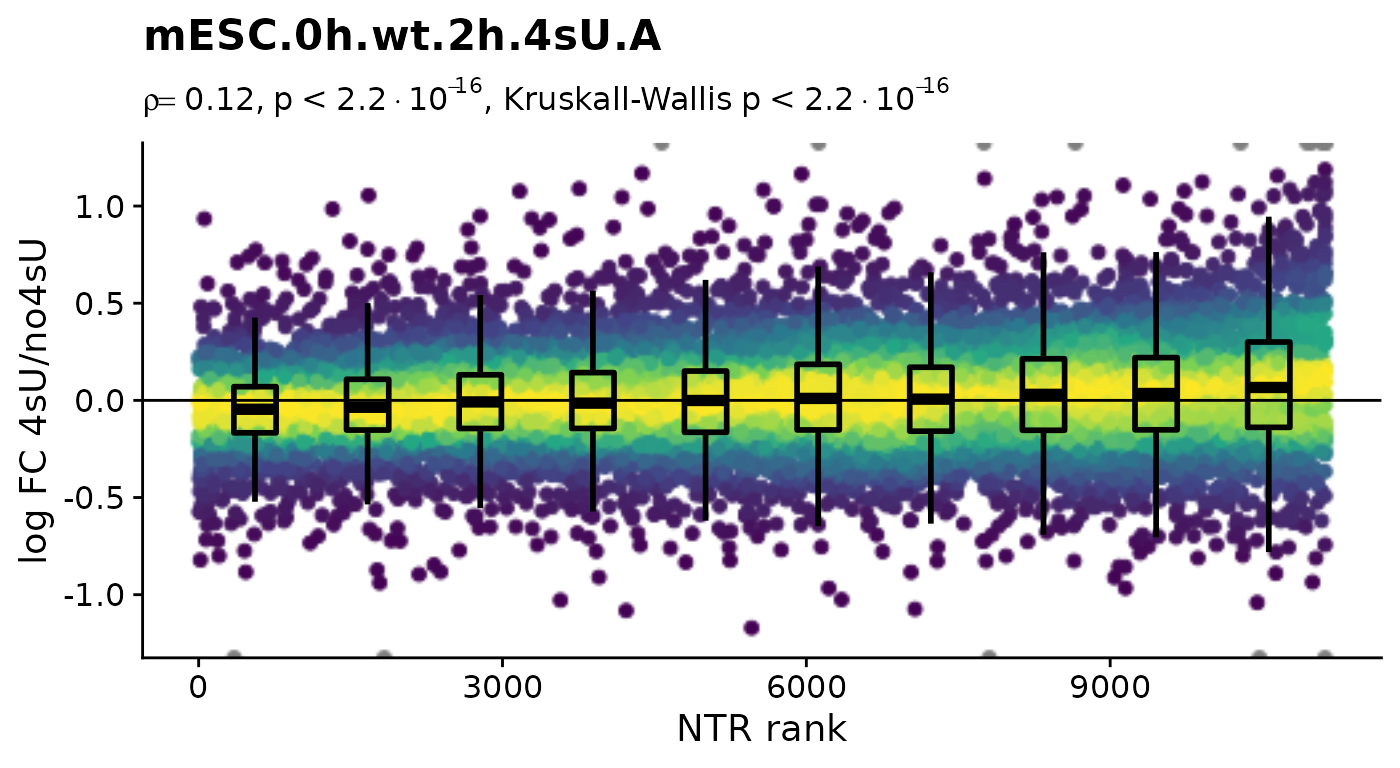
$mESC.0h.wt.2h.4sU.B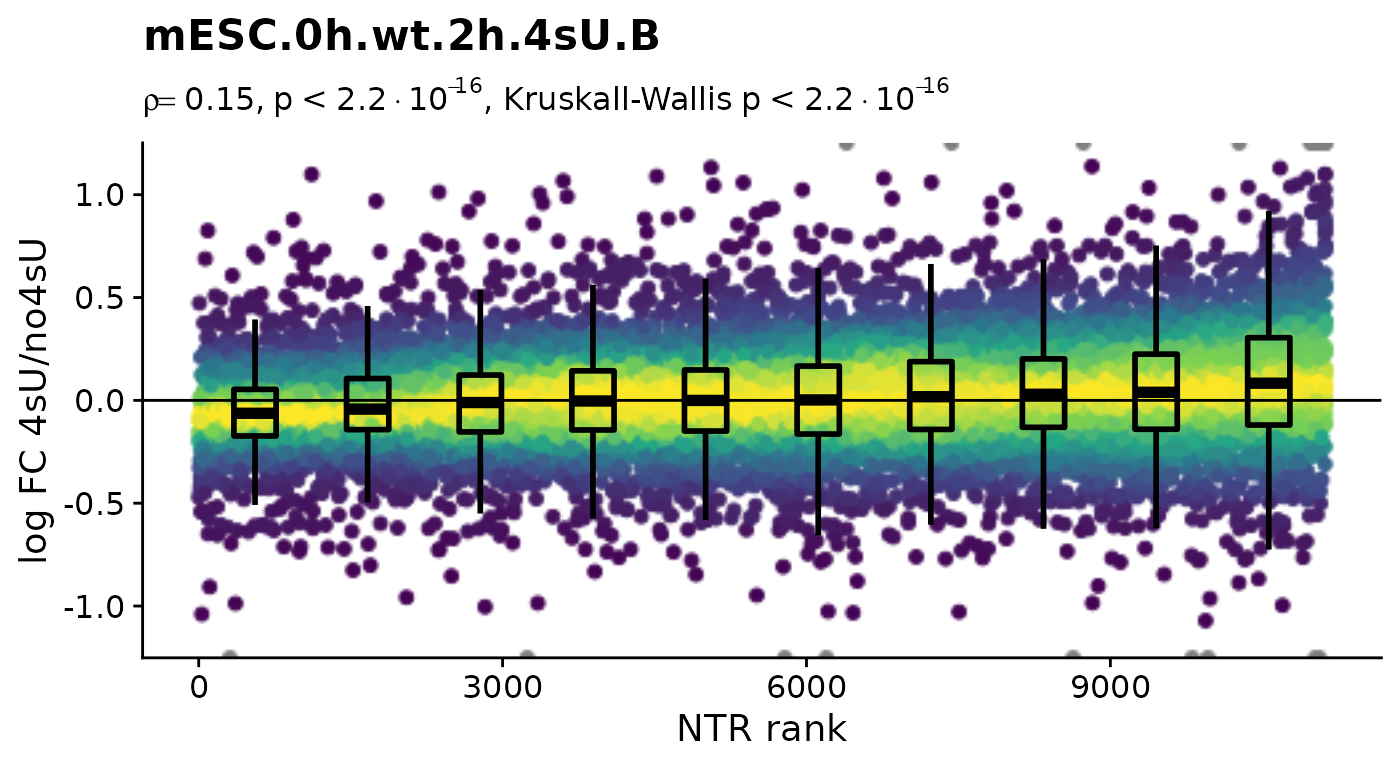
$mESC.0h.wt.2h.4sU.C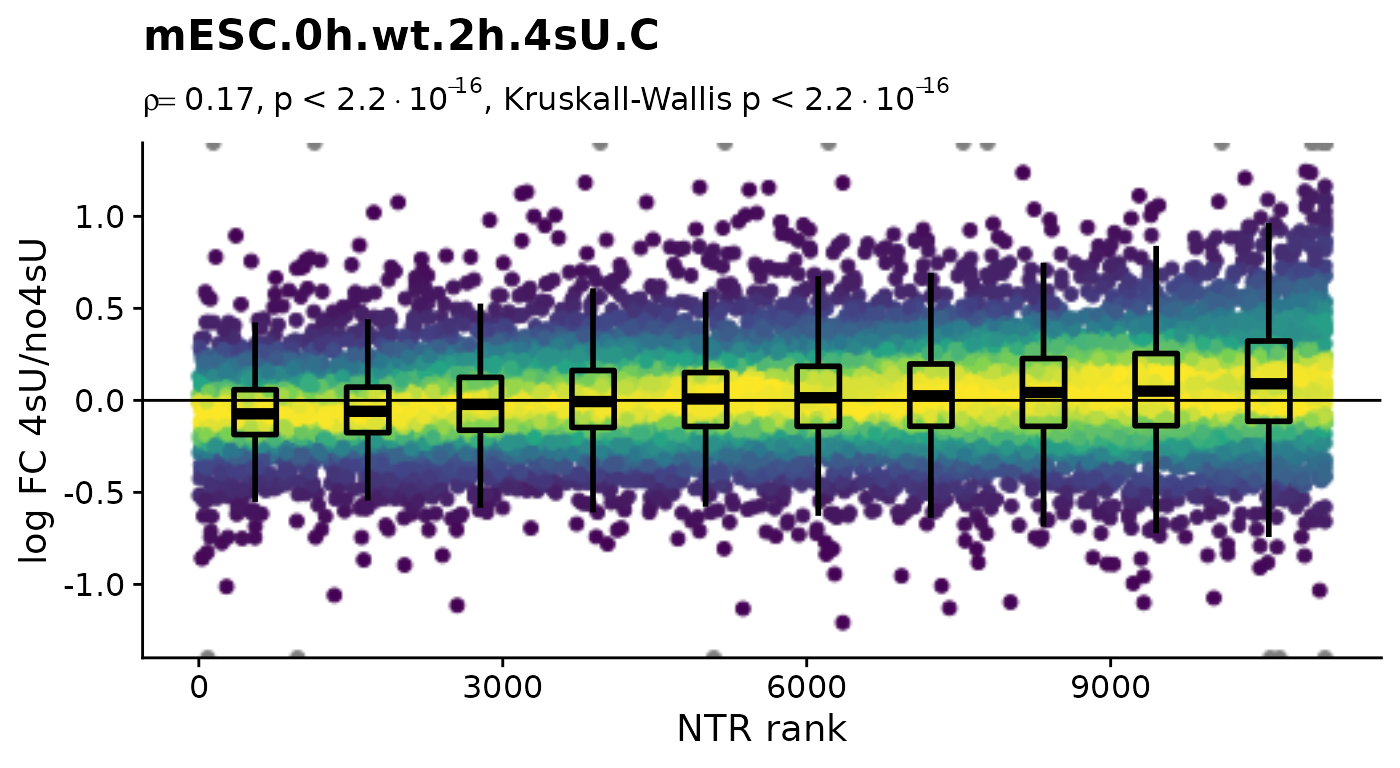
Here, there is no negative correlation, so it is not a shutdown of transcription that results in the observed differences between the 4sU treated and 4sU naive samples. So, let’s see whether observed changes are reproducible among replicates. For that we will compute the Wald test implemented in DESeq2 for all comparisons defined above (as we will need this also for the dTag effect).
banp <- PairwiseDESeq2(banp,name.prefix = "QC",contrasts=contrasts)
banp
grandR:
Read from https://zenodo.org/record/6976391/files/BANP
11147 genes, 23 samples/cells
Available data slots: count,ntr,alpha,beta
Available analyses: QC.4sU effect,QC.dTag effect
Available plots:
Default data slot: countThis obviously did not add new analysis tables, but since the names matched, it added the new statistics computed by DESeq2 to the existing tables (if there were statistics with the same name as already existing, i.e. “LFC”, we would get a warning).
Analyses(banp,description = TRUE)$`QC.4sU effect`
[1] "LFC" "M" "S" "P" "Q"
$`QC.dTag effect`
[1] "LFC" "M" "S" "P" "Q" Now we can have a look at a Vulcano plot for the 4sU effect:
VulcanoPlot(banp,analysis = "QC.4sU effect",lfc.cutoff = 0.5,ylim=c(-9,50))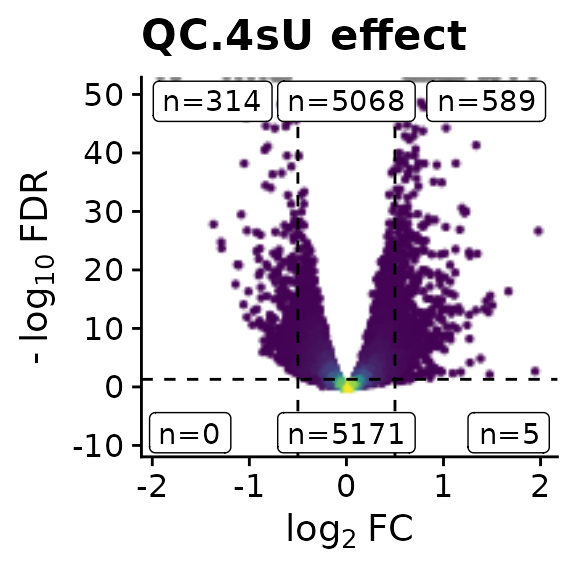
We can also create an MA plot:
MAPlot(banp,analysis = "QC.4sU effect",lfc.cutoff = 1)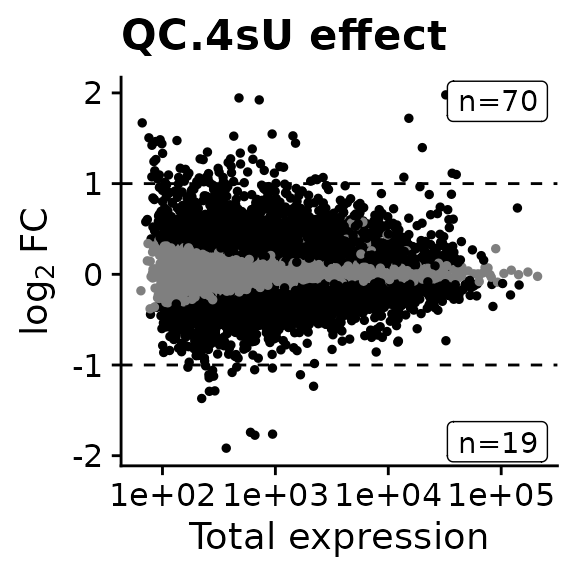
We see that there are indeed quite some genes with statistically significant changes. We can also retrieve the genes:
GetSignificantGenes(banp,analysis = "QC.4sU effect",criteria = LFC< -1 & Q<0.05) [1] "Lefty1" "Lef1" "Ccng2" "Plac8" "Usp29" "Bhlhe40" "Bnip3"
[8] "Kcnk1" "Ap1m2" "P4ha1" "Gstt1" "Crispld2" "Stc2" "Slc16a3"
[15] "Egln3" "Hist1h2aa" "Hist1h1t" "Cldn6" "Egr1"
GetSignificantGenes(banp,analysis = "QC.4sU effect",criteria = LFC>1 & Q<0.05) [1] "Dst" "Sned1" "Dock10" "Gm20342" "Gm10801"
[6] "Gm26901" "Gm20045" "Gm10800" "Cdh4" "Map1a"
[11] "Ttn" "Fam212b" "Hist2h2ab" "Gm37584" "Cavin4"
[16] "Gm13067" "Zc3h12a" "2700016F22Rik" "Klhdc7a" "Hspg2"
[21] "Macf1" "Rprl1" "Plaur" "Dyrk1b" "Iqck"
[26] "Cox6b2" "Gm26890" "Sox1" "Mt2" "Mt1"
[31] "Gm26532" "Gpr83" "Gm45250" "Exoc3l" "Hyal1"
[36] "Slc25a42" "4833445I07Rik" "Izumo4" "Soga3" "AU041133"
[41] "Eid3" "Vamp2" "D930048N14Rik" "Gm21781" "B130006D01Rik"
[46] "Zfp672" "Baiap2" "Gm5784" "Ahnak2" "Hist1h2ah"
[51] "Hist1h2af" "Mir124a-1hg" "Zfhx2" "Gm29666" "Rapgef3"
[56] "Pdzd2" "Ankrd33b" "Gm9918" "2610037D02Rik" "Spaca6"
[61] "Yipf3" "Mcc" "Gm26917" "Gm42418" "Ahnak"
[66] "Gm26992" "Rnf128" "Gm21887" "Trpc5os" "Neat1" The criteria parameter can be used to define which genes
you want to have. The criteria must be an expression that
either evaluates into a numeric or logical vector. In the first case,
you will get all genes ordered according to the given criteria, in the
latter case (as done above), you will get the genes meeting the
criteria. The columns of the given analysis table (see above) can be
used to build this expression.
There are no obvious (at least to us) biological functions for these genes. We therefore perform gene set enrichment analysis (GSEA) on MSigDB hallmark gene sets:
gsea <- AnalyzeGeneSets(banp,analysis = "QC.4sU effect",category="H")Found 50 gene sets!
Performing GSEA (using fgsea)...preparing geneSet collections...GSEA analysis...Warning in preparePathwaysAndStats(pathways, stats, minSize, maxSize, gseaParam, : There are ties in the preranked stats (0.14% of the list).
The order of those tied genes will be arbitrary, which may produce unexpected results.leading edge analysis...done...
clusterProfiler::ridgeplot(gsea)Picking joint bandwidth of 0.0667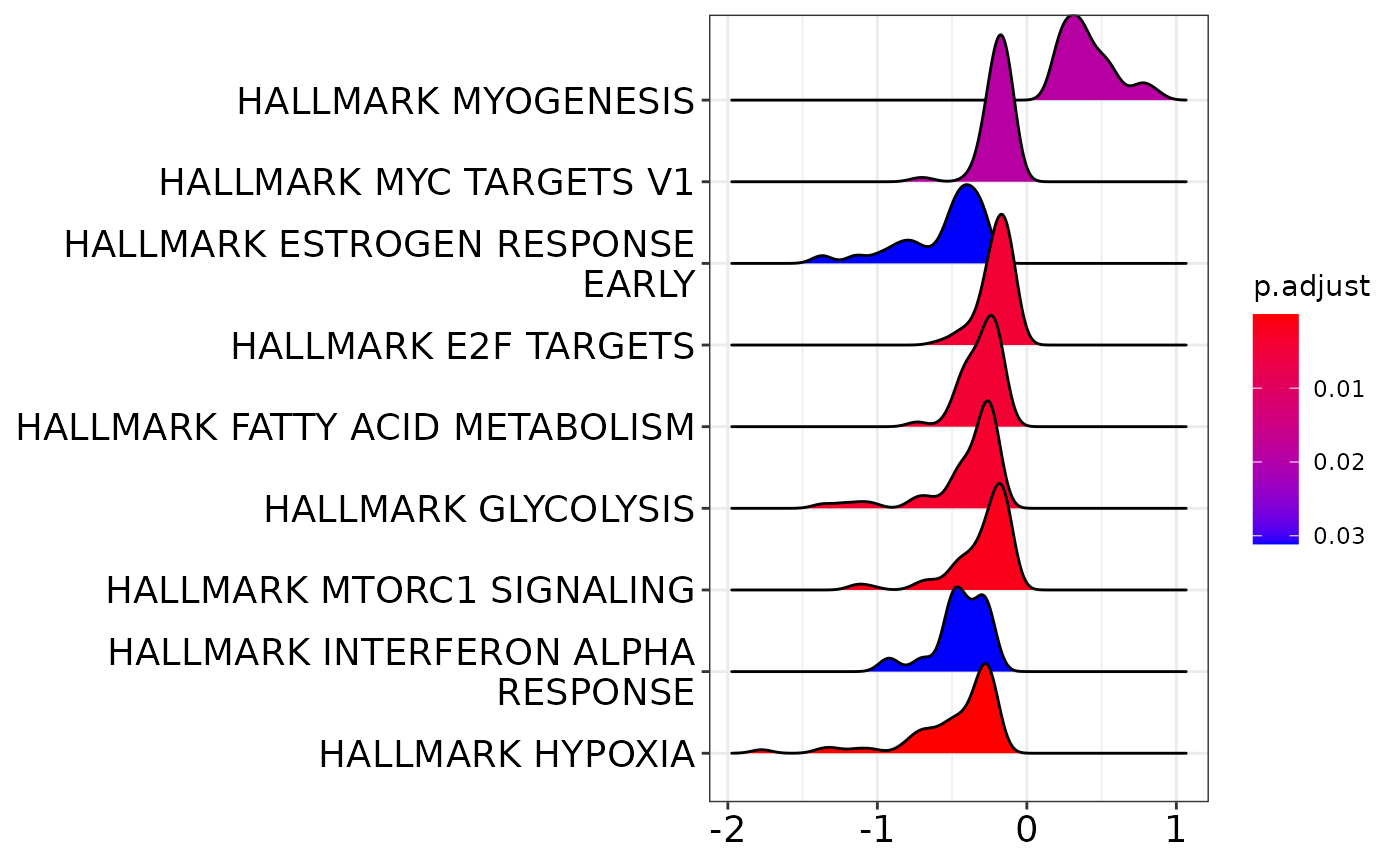
Thus, there are quite some pathways that are affected.
Technically, AnalyzeGeneSets provides a convenient
wrapper to perform either GSEA and ORA (overrepresentation analyses)
using the clusterProfiler
package on a lot of predefined gene sets from the msigdbr package.
You can learn about the gene sets using the ListGeneSets
function:
| category | subcategory | n | category description |
|---|---|---|---|
| C1 | 299 | Positional gene sets for each human chromosome and cytogenetic band. | |
| C2 | CGP | 3384 | Curated gene sets from online pathway databases, publications in PubMed, and knowledge of domain experts. |
| C2 | CP | 29 | Curated gene sets from online pathway databases, publications in PubMed, and knowledge of domain experts. |
| C2 | CP:BIOCARTA | 292 | Curated gene sets from online pathway databases, publications in PubMed, and knowledge of domain experts. |
| C2 | CP:KEGG | 186 | Curated gene sets from online pathway databases, publications in PubMed, and knowledge of domain experts. |
| C2 | CP:PID | 196 | Curated gene sets from online pathway databases, publications in PubMed, and knowledge of domain experts. |
| C2 | CP:REACTOME | 1615 | Curated gene sets from online pathway databases, publications in PubMed, and knowledge of domain experts. |
| C2 | CP:WIKIPATHWAYS | 664 | Curated gene sets from online pathway databases, publications in PubMed, and knowledge of domain experts. |
| C3 | MIR:MIRDB | 2377 | Regulatory target gene sets based on gene target predictions for microRNA seed sequences and predicted transcription factor binding sites. |
| C3 | MIR:MIR_Legacy | 221 | Regulatory target gene sets based on gene target predictions for microRNA seed sequences and predicted transcription factor binding sites. |
| C3 | TFT:GTRD | 518 | Regulatory target gene sets based on gene target predictions for microRNA seed sequences and predicted transcription factor binding sites. |
| C3 | TFT:TFT_Legacy | 610 | Regulatory target gene sets based on gene target predictions for microRNA seed sequences and predicted transcription factor binding sites. |
| C4 | CGN | 427 | Computational gene sets defined by mining large collections of cancer-oriented microarray data. |
| C4 | CM | 431 | Computational gene sets defined by mining large collections of cancer-oriented microarray data. |
| C5 | GO:BP | 7658 | Ontology gene sets consist of genes annotated by the same ontology term. |
| C5 | GO:CC | 1006 | Ontology gene sets consist of genes annotated by the same ontology term. |
| C5 | GO:MF | 1738 | Ontology gene sets consist of genes annotated by the same ontology term. |
| C5 | HPO | 5071 | Ontology gene sets consist of genes annotated by the same ontology term. |
| C6 | 189 | Oncogenic signature gene sets defined directly from microarray gene expression data from cancer gene perturbations. | |
| C7 | IMMUNESIGDB | 4872 | Immunologic signature gene sets represent cell states and perturbations within the immune system. |
| C7 | VAX | 347 | Immunologic signature gene sets represent cell states and perturbations within the immune system. |
| C8 | 700 | Cell type signature gene sets curated from cluster markers identified in single-cell sequencing studies of human tissue. | |
| H | 50 | Hallmark gene sets are coherently expressed signatures derived by aggregating many MSigDB gene sets to represent well-defined biological states or processes. |
The values from the category and subcategory columns can be used to
the corresponding parameters of AnalyzeGeneSets.
The criteria parameter can be used to define how
analyses are performed. The criteria must be an expression
that either evaluates into a numeric or logical vector. In the first
case, GSEA is performed, in the latter it is ORA. The columns of the
given analysis table (see above) can be used to build this expression.
Thus, to perform ORA for down-regulated genes:
AnalyzeGeneSets(banp,analysis = "QC.4sU effect",category="H",criteria = LFC<0.5 & Q<0.05)Found 50 gene sets!
Performing ORA (for n=5382/11147 genes)...#
# over-representation test
#
#...@organism UNKNOWN
#...@ontology UNKNOWN
#...@gene chr [1:11147] "ENSMUSG00000025776" "ENSMUSG00000025931" "ENSMUSG00000025940" ...
#...pvalues adjusted by 'BH' with cutoff <0.05
#...0 enriched terms found
#...Citation
T Wu, E Hu, S Xu, M Chen, P Guo, Z Dai, T Feng, L Zhou, W Tang, L Zhan, X Fu, S Liu, X Bo, and G Yu.
clusterProfiler 4.0: A universal enrichment tool for interpreting omics data.
The Innovation. 2021, 2(3):100141 Differential analysis of dTag vs wt
We next investigate whether there is anything peculiar about the expression differences between the dTag and wild-type cells:
VulcanoPlot(banp,analysis = "QC.dTag effect",ylim=c(-40,300))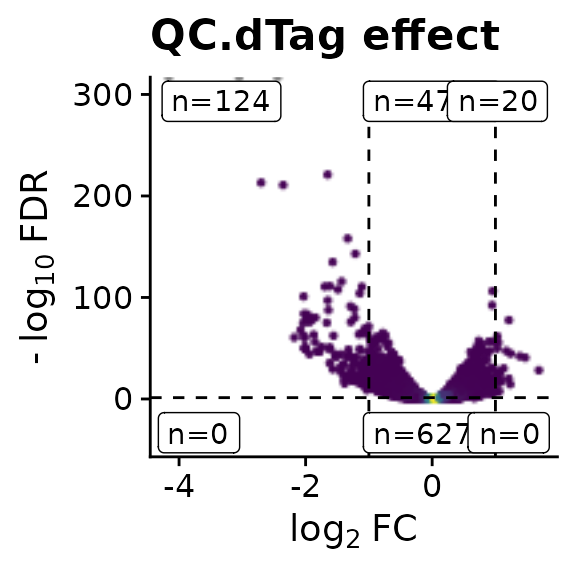
There are a lot of genes that are substantially and statistically significantly downregulated.
gsea <- AnalyzeGeneSets(banp,analysis = "QC.dTag effect",category="C5",subcategory = "GO:BP")Querying msigdb for C5 (GO:BP) in Mus musculus ...
Found 7656 gene sets!
Performing GSEA (using fgsea)...preparing geneSet collections...GSEA analysis...Warning in preparePathwaysAndStats(pathways, stats, minSize, maxSize, gseaParam, : There are ties in the preranked stats (0.16% of the list).
The order of those tied genes will be arbitrary, which may produce unexpected results.leading edge analysis...done...
clusterProfiler::ridgeplot(gsea)Picking joint bandwidth of 0.0906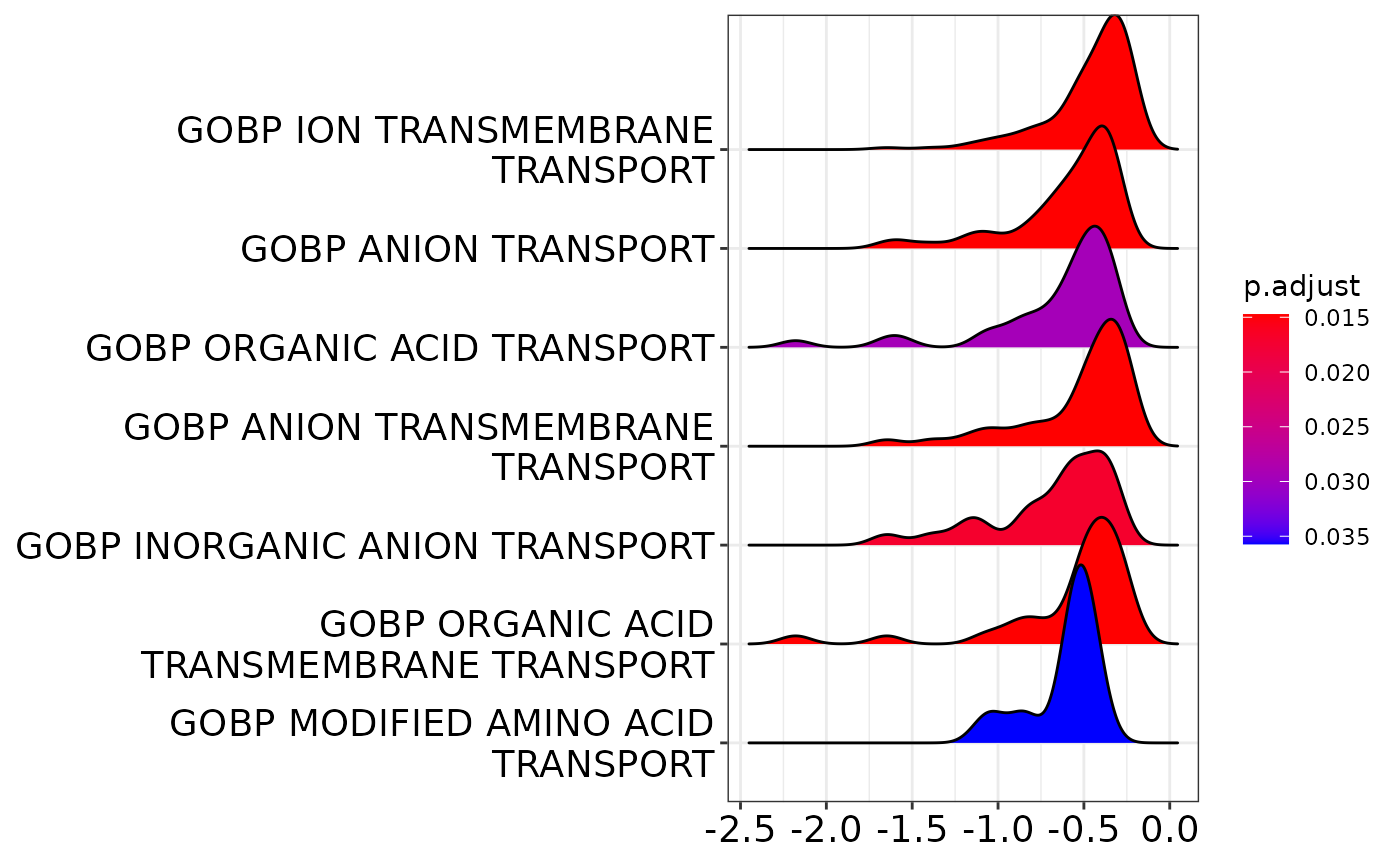
Apparently, predominantly genes that have to do with transmembrane transport are downregulated.
Differential analysis of BANP depletion
Before we continue, we add the information which genes are have BANP-ChIP-seq peaks in their promoters:
tar <- readLines("https://zenodo.org/record/6976391/files/targets.genes")
GeneInfo(banp,"BANP-Target")<-factor(ifelse(Genes(banp) %in% tar,"yes","no"),levels=c("yes","no"))
table(GeneInfo(banp,"BANP-Target"))
  yes    no
  457 10690
We remove the “wt” samples and define contrasts:
banp <- subset(banp,columns = Genotype=="dTag")
contrasts <- GetContrasts(banp,contrast=c("Experimental.time.original","0h"))
contrasts| 1h vs 0h | 2h vs 0h | 4h vs 0h | 6h vs 0h | 20h vs 0h | |
|---|---|---|---|---|---|
| mESC.0h.dTag.2h.4sU.A | -1 | -1 | -1 | -1 | -1 |
| mESC.0h.dTag.2h.4sU.B | -1 | -1 | -1 | -1 | -1 |
| mESC.1h.dTag.30min.4sU.A | 1 | 0 | 0 | 0 | 0 |
| mESC.1h.dTag.30min.4sU.B | 1 | 0 | 0 | 0 | 0 |
| mESC.1h.dTag.30min.4sU.C | 1 | 0 | 0 | 0 | 0 |
| mESC.2h.dTag.90min.4sU.A | 0 | 1 | 0 | 0 | 0 |
| mESC.2h.dTag.90min.4sU.B | 0 | 1 | 0 | 0 | 0 |
| mESC.2h.dTag.90min.4sU.C | 0 | 1 | 0 | 0 | 0 |
| mESC.4h.dTag.120min.4sU.A | 0 | 0 | 1 | 0 | 0 |
| mESC.4h.dTag.120min.4sU.B | 0 | 0 | 1 | 0 | 0 |
| mESC.4h.dTag.120min.4sU.C | 0 | 0 | 1 | 0 | 0 |
| mESC.6h.dTag.120min.4sU.A | 0 | 0 | 0 | 1 | 0 |
| mESC.6h.dTag.120min.4sU.B | 0 | 0 | 0 | 1 | 0 |
| mESC.6h.dTag.120min.4sU.C | 0 | 0 | 0 | 1 | 0 |
| mESC.20h.dTag.120min.4sU.A | 0 | 0 | 0 | 0 | 1 |
| mESC.20h.dTag.120min.4sU.B | 0 | 0 | 0 | 0 | 1 |
| mESC.20h.dTag.120min.4sU.C | 0 | 0 | 0 | 0 | 1 |
Now we perform LFC and DESeq2 analyses. We will perform this on the level of both total an new RNA. Also for new RNA fold changes, we normalize with respect to total RNA (i.e. size factors are computed based on total RNA before performing differential analysis with new RNA).
banp <- LFC(banp,name.prefix = "total",contrasts = contrasts)
banp <- PairwiseDESeq2(banp,name.prefix = "total",contrasts = contrasts)
Warning in AddAnalysis(data, name = if (is.null(name.prefix)) n else paste0(name.prefix, :
Analysis total.1h vs 0h already present! Adding: S, P, Q, Overwritting: M, keeping: LFC...Warning in AddAnalysis(data, name = if (is.null(name.prefix)) n else paste0(name.prefix, :
Analysis total.2h vs 0h already present! Adding: S, P, Q, Overwritting: M, keeping: LFC...Warning in AddAnalysis(data, name = if (is.null(name.prefix)) n else paste0(name.prefix, :
Analysis total.4h vs 0h already present! Adding: S, P, Q, Overwritting: M, keeping: LFC...Warning in AddAnalysis(data, name = if (is.null(name.prefix)) n else paste0(name.prefix, :
Analysis total.6h vs 0h already present! Adding: S, P, Q, Overwritting: M, keeping: LFC...Warning in AddAnalysis(data, name = if (is.null(name.prefix)) n else paste0(name.prefix, :
Analysis total.20h vs 0h already present! Adding: S, P, Q, Overwritting: M, keeping: LFC...
banp <- LFC(banp,name.prefix = "new",contrasts = contrasts,mode="new", normalization = "total")
banp <- PairwiseDESeq2(banp,name.prefix = "new",contrasts = contrasts,mode="new", normalization = "total")
Warning in AddAnalysis(data, name = if (is.null(name.prefix)) n else paste0(name.prefix, :
Analysis new.1h vs 0h already present! Adding: S, P, Q, Overwritting: M, keeping: LFC...Warning in AddAnalysis(data, name = if (is.null(name.prefix)) n else paste0(name.prefix, :
Analysis new.2h vs 0h already present! Adding: S, P, Q, Overwritting: M, keeping: LFC...Warning in AddAnalysis(data, name = if (is.null(name.prefix)) n else paste0(name.prefix, :
Analysis new.4h vs 0h already present! Adding: S, P, Q, Overwritting: M, keeping: LFC...Warning in AddAnalysis(data, name = if (is.null(name.prefix)) n else paste0(name.prefix, :
Analysis new.6h vs 0h already present! Adding: S, P, Q, Overwritting: M, keeping: LFC...Warning in AddAnalysis(data, name = if (is.null(name.prefix)) n else paste0(name.prefix, :
Analysis new.20h vs 0h already present! Adding: S, P, Q, Overwritting: M, keeping: LFC...Note that actually new RNA comparisons do not make sense at all for 1h and (maybe) 2h, since the labeling times for these samples were 30min and 90 min, respectively, whereas the labeling time for all other samples was 2h:
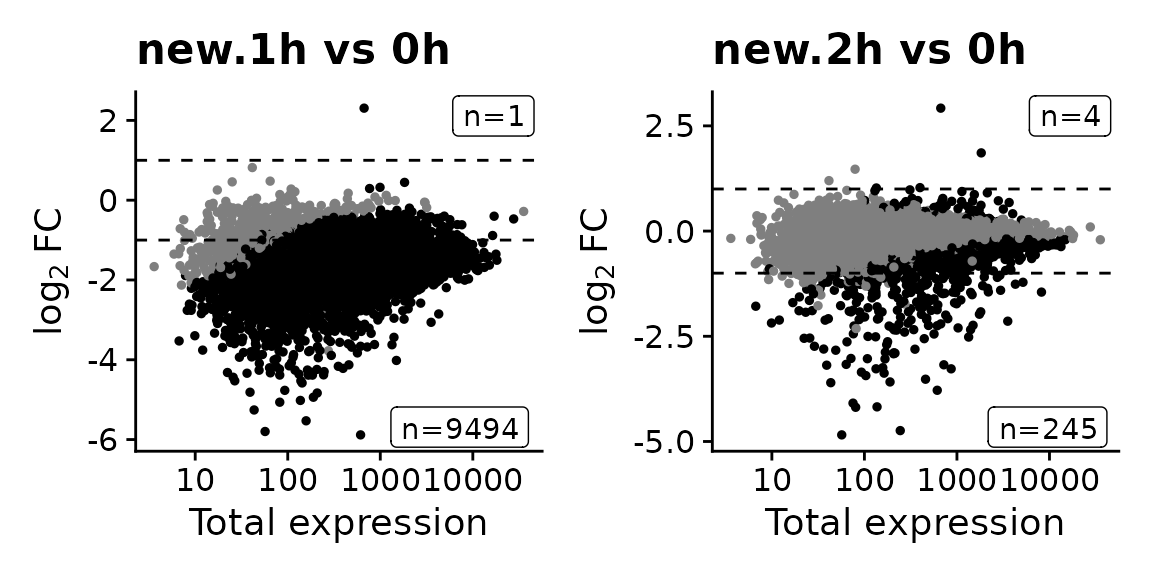
The MA plots indicate that changes in new RNA are much more pronounced than changes in total RNA, even after 4h:
MAPlot(banp,analysis = "total.4h vs 0h",highlight=GeneInfo(banp,"BANP-Target")=="yes")|
  MAPlot(banp,analysis = "new.4h vs 0h",highlight=GeneInfo(banp,"BANP-Target")=="yes")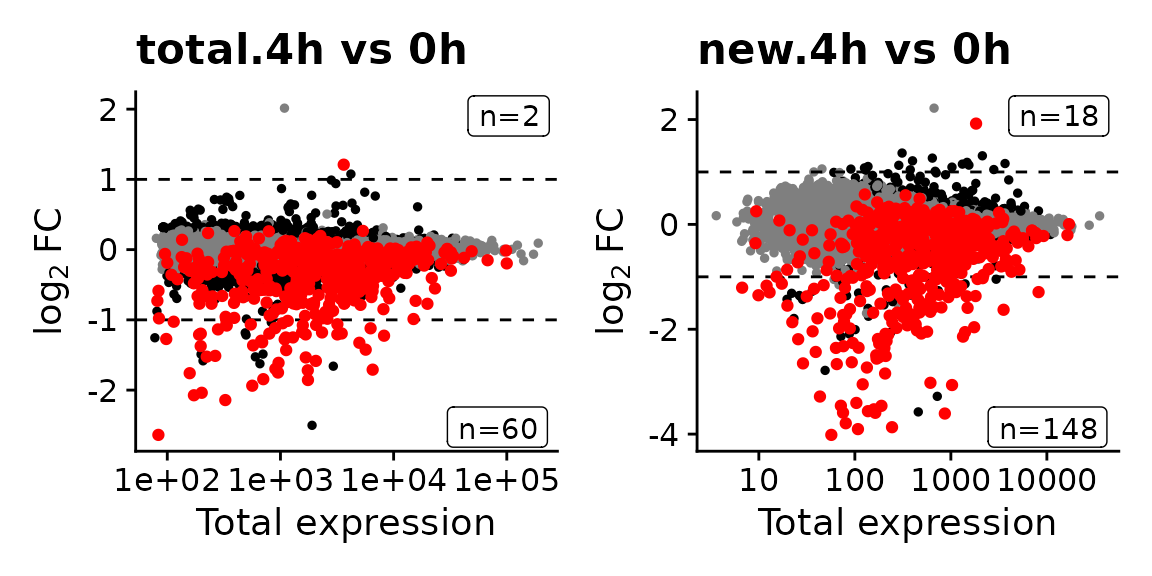
We compare this using boxplots:
df <- GetAnalysisTable(banp,analyses = "4h",by.rows = TRUE)
ggplot(df,aes(Analysis,LFC,fill=`BANP-Target`))+
  geom_hline(yintercept = 0)+
  geom_boxplot()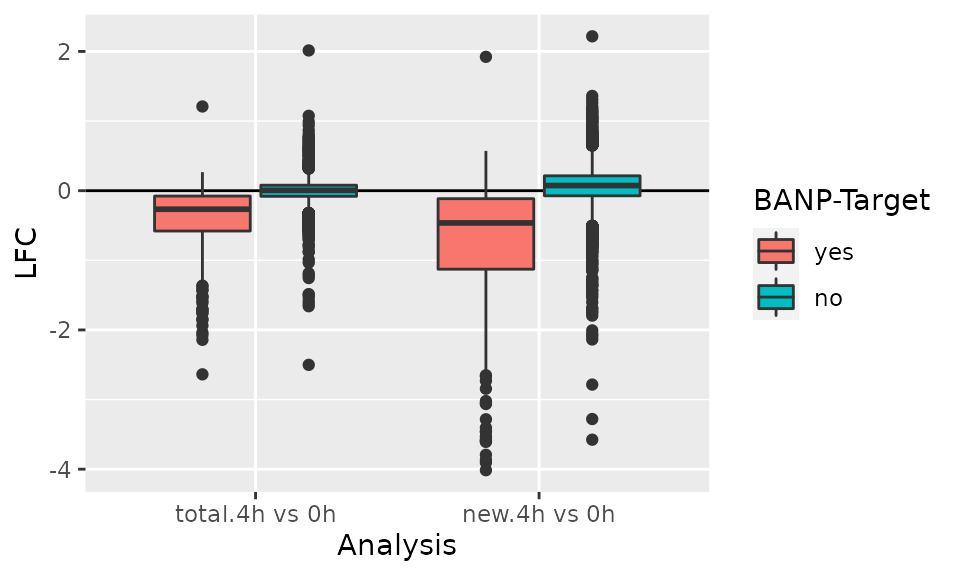
Let’s investigate this further. We first roughly estimate RNA half-lives from steady state samples using the method described in [1], and add half-life classes as additional gene annotations:
banp <- ComputeSteadyStateHalfLives(banp,name="HL",columns = Experimental.time==0)
GeneInfo(banp,"HL simple") <- rowMeans(GetAnalysisTable(banp,analyses = "HL",gene.info = FALSE))
GeneInfo(banp,"HL category") <- cut(GeneInfo(banp,"HL simple"),
                                    breaks=c(0,2,4,8,Inf),
                                    labels=c("0-2h","2-4h","4-8h",">8h"))
table(GeneInfo(banp,"HL category"))
0-2h 2-4h 4-8h  >8h
1763 3433 3730 2207
Now we can do the same comparison as above but differentiate between half-life classes:
df <- GetAnalysisTable(banp,analyses = "4h vs 0h",by.rows = TRUE)
df <- df[!is.na(df$`HL category`),]
ggplot(df,aes(`HL category`,LFC,fill=`BANP-Target`))+
  geom_hline(yintercept = 0)+
  geom_boxplot()+
  RotatateAxisLabels()+
  facet_wrap(~Analysis)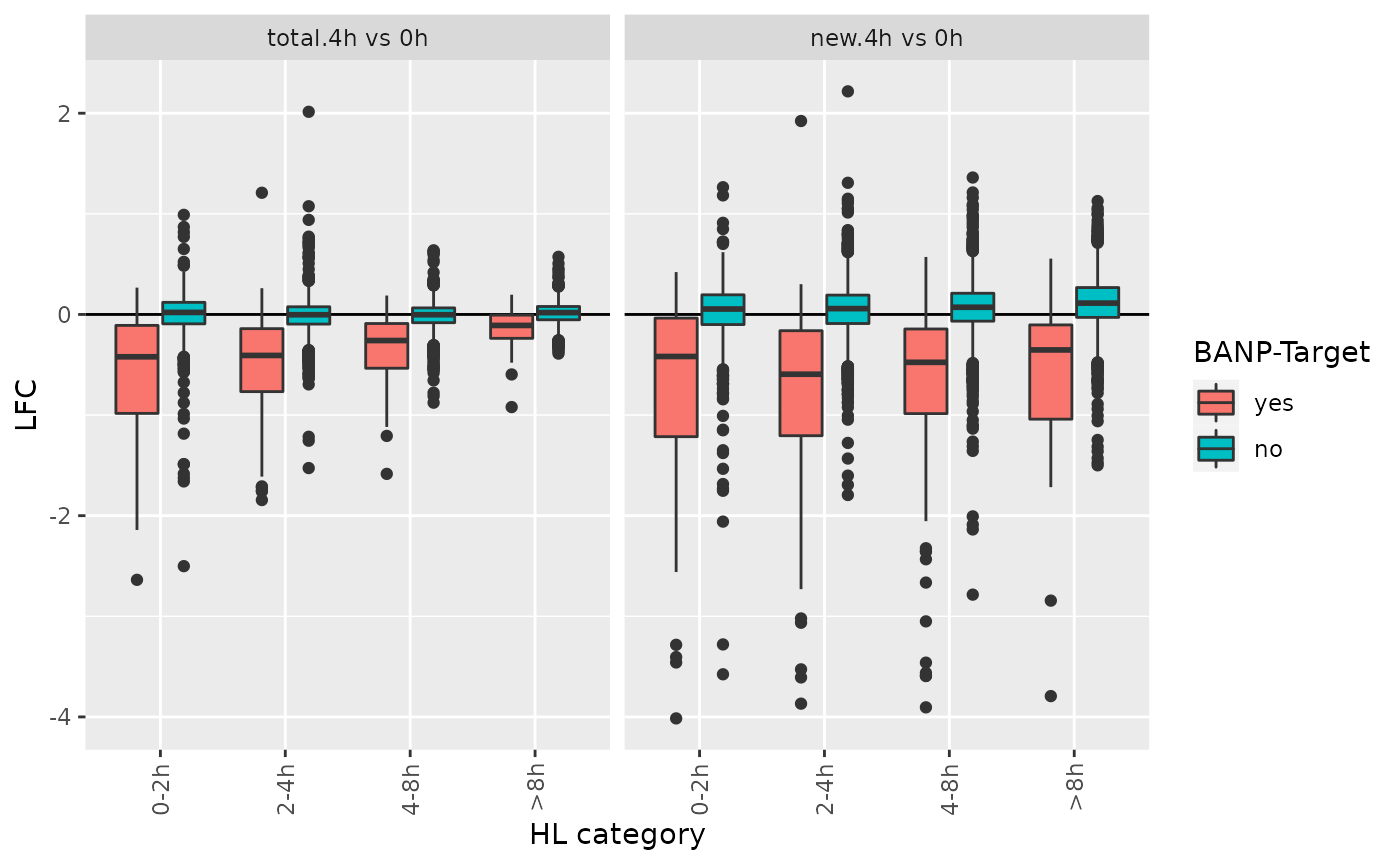
For genes with long RNA half-lives, down-regulation of BANP targets is masked by pre-existing RNA, when total RNA is analyzed. Analysis of new RNA does not suffer from this. This indicates that it indeed was important to use metabolic RNA labeling, because many changes that actually happened in terms of gene regulation are simply masked on the level of total RNA by all the pre-existing RNA that has not been degraded yet.
The real deal: Bayesian analysis of snapshot experiments
As indicated above, the 1h and 2h samples are not directly comparable to the other samples, due to different labeling times. Thus, we will use grandR to model changes of RNA half-lives and synthesis rates from the given snapshot experiments. We first check whether labeling times need to be recalibrated. Exact effective labeling times for important for modeling but are actually also important when you compare new RNA among samples using LFC and DESeq2 (see above).
For checking, we fit our model per experimental time. We use
N=0 because we do not want to draw samples from the
posterior, but we are happy with transforming the MAP estimates for this
check:
# Restrict to 1000 genes to execute this vignette much faster
set.seed(42)
banp<-FilterGenes(banp,use=sample.int(nrow(banp),1000))

# use the previous time point as reference
reference.columns=FindReferences(banp,reference.function=
                                   function(s) Experimental.time==max(c(0,Experimental.time[Experimental.time<s$Experimental.time])))

SetParallel(cores = 2)  # increase on your system, or omit the cores = 2 for automatic detection
Condition(banp) <- "Experimental.time.original"
banp <- FitKineticsSnapshot(banp,name.prefix = "MAP",reference.columns=reference.columns,
                            verbose=T,time.experiment = "Experimental.time",N=0)
Computing snapshot kinetics for 0h...
Sampling from steady state for mESC.0h.dTag.2h.4sU.A,mESC.0h.dTag.2h.4sU.B...
Beta prior for mESC.0h.dTag.2h.4sU.A,mESC.0h.dTag.2h.4sU.B: a=4.737, b=33.299
Computing snapshot kinetics for 1h...
Sampling from non-steady state for mESC.1h.dTag.30min.4sU.A,mESC.1h.dTag.30min.4sU.B,mESC.1h.dTag.30min.4sU.C (reference: mESC.0h.dTag.2h.4sU.A,mESC.0h.dTag.2h.4sU.B)...
Beta prior for mESC.1h.dTag.30min.4sU.A,mESC.1h.dTag.30min.4sU.B,mESC.1h.dTag.30min.4sU.C: a=4.665, b=30.348
Computing snapshot kinetics for 2h...
Sampling from non-steady state for mESC.2h.dTag.90min.4sU.A,mESC.2h.dTag.90min.4sU.B,mESC.2h.dTag.90min.4sU.C (reference: mESC.1h.dTag.30min.4sU.A,mESC.1h.dTag.30min.4sU.B,mESC.1h.dTag.30min.4sU.C)...
Beta prior for mESC.2h.dTag.90min.4sU.A,mESC.2h.dTag.90min.4sU.B,mESC.2h.dTag.90min.4sU.C: a=7.284, b=20.591
Computing snapshot kinetics for 4h...
Sampling from non-steady state for mESC.4h.dTag.120min.4sU.A,mESC.4h.dTag.120min.4sU.B,mESC.4h.dTag.120min.4sU.C (reference: mESC.2h.dTag.90min.4sU.A,mESC.2h.dTag.90min.4sU.B,mESC.2h.dTag.90min.4sU.C)...
Beta prior for mESC.4h.dTag.120min.4sU.A,mESC.4h.dTag.120min.4sU.B,mESC.4h.dTag.120min.4sU.C: a=12.670, b=32.046
Computing snapshot kinetics for 6h...
Sampling from non-steady state for mESC.6h.dTag.120min.4sU.A,mESC.6h.dTag.120min.4sU.B,mESC.6h.dTag.120min.4sU.C (reference: mESC.4h.dTag.120min.4sU.A,mESC.4h.dTag.120min.4sU.B,mESC.4h.dTag.120min.4sU.C)...
Beta prior for mESC.6h.dTag.120min.4sU.A,mESC.6h.dTag.120min.4sU.B,mESC.6h.dTag.120min.4sU.C: a=2.416, b=15.402
Computing snapshot kinetics for 20h...
Sampling from non-steady state for mESC.20h.dTag.120min.4sU.A,mESC.20h.dTag.120min.4sU.B,mESC.20h.dTag.120min.4sU.C (reference: mESC.6h.dTag.120min.4sU.A,mESC.6h.dTag.120min.4sU.B,mESC.6h.dTag.120min.4sU.C)...
Beta prior for mESC.20h.dTag.120min.4sU.A,mESC.20h.dTag.120min.4sU.B,mESC.20h.dTag.120min.4sU.C: a=4.463, b=14.129Now we can obtain the analysis table and plot the distributions of half-live estimated from each timepoint:
df <- GetAnalysisTable(banp,analyses = "^MAP",by.rows = TRUE)
df$HL=pmin(df$HL,48)   # for 4h, there are extreme outliers, which mess up the computation of violins
ggplot(df,aes(Analysis,HL))+
  geom_boxplot()+
  scale_y_log10()+
  coord_cartesian(ylim=c(0.3,24))
Warning: Transformation introduced infinite values in continuous y-axisWarning: Removed 4 rows containing non-finite values (stat_boxplot).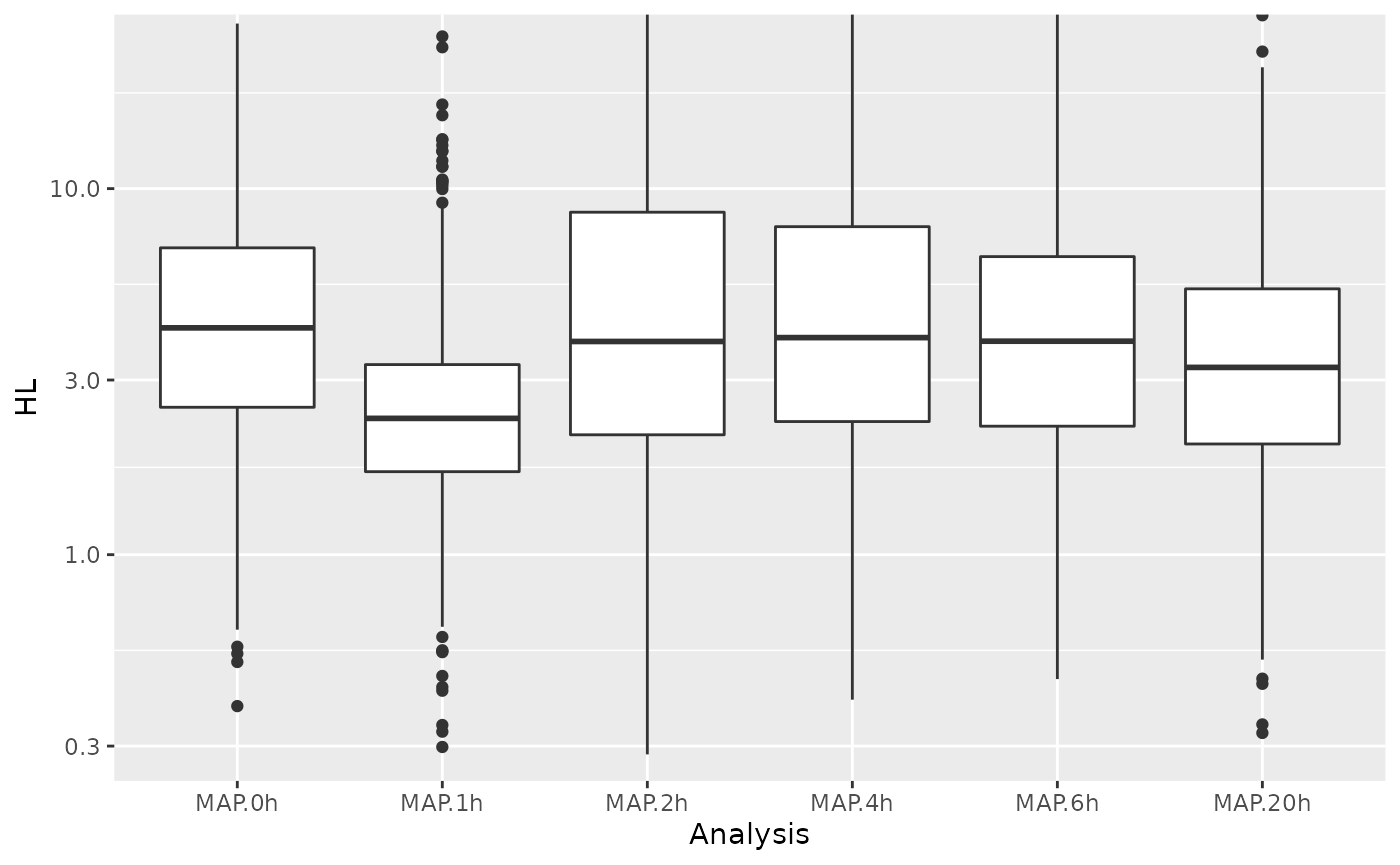
Especially for 1h, the half-lives are strongly biased, indicating
that the effective labeling time was different from the nominal labeling
time. We recalibrate by finding effective labeling times such that the
estimated half-lives for each sample match to our reference half-lives
computed above. Note that
CalibrateEffectiveLabelingTimeMatchHalflives will only do
this on 1,000 genes selected by strong expression from each half-life
class.
banp <- Normalize(banp)
banp <- CalibrateEffectiveLabelingTimeMatchHalflives(banp,
                            reference.halflives = GeneInfo(banp,"HL simple"),
                            reference.columns = reference.columns,verbose=TRUE)
banp <- FitKineticsSnapshot(banp,name.prefix = "cMAP",reference.columns=reference.columns,
                            time.experiment = "Experimental.time",verbose=TRUE,
                            time.labeling = "calibrated_time",N=0,correct.labeling = TRUE)
Computing snapshot kinetics for 0h...
Sampling from steady state for mESC.0h.dTag.2h.4sU.A,mESC.0h.dTag.2h.4sU.B...
Beta prior for mESC.0h.dTag.2h.4sU.A,mESC.0h.dTag.2h.4sU.B: a=4.742, b=31.936
Computing snapshot kinetics for 1h...
Sampling from non-steady state for mESC.1h.dTag.30min.4sU.A,mESC.1h.dTag.30min.4sU.B,mESC.1h.dTag.30min.4sU.C (reference: mESC.0h.dTag.2h.4sU.A,mESC.0h.dTag.2h.4sU.B)...
Beta prior for mESC.1h.dTag.30min.4sU.A,mESC.1h.dTag.30min.4sU.B,mESC.1h.dTag.30min.4sU.C: a=4.656, b=31.514
Computing snapshot kinetics for 2h...
Sampling from non-steady state for mESC.2h.dTag.90min.4sU.A,mESC.2h.dTag.90min.4sU.B,mESC.2h.dTag.90min.4sU.C (reference: mESC.1h.dTag.30min.4sU.A,mESC.1h.dTag.30min.4sU.B,mESC.1h.dTag.30min.4sU.C)...
Beta prior for mESC.2h.dTag.90min.4sU.A,mESC.2h.dTag.90min.4sU.B,mESC.2h.dTag.90min.4sU.C: a=7.277, b=20.915
Computing snapshot kinetics for 4h...
Sampling from non-steady state for mESC.4h.dTag.120min.4sU.A,mESC.4h.dTag.120min.4sU.B,mESC.4h.dTag.120min.4sU.C (reference: mESC.2h.dTag.90min.4sU.A,mESC.2h.dTag.90min.4sU.B,mESC.2h.dTag.90min.4sU.C)...
Beta prior for mESC.4h.dTag.120min.4sU.A,mESC.4h.dTag.120min.4sU.B,mESC.4h.dTag.120min.4sU.C: a=12.671, b=32.000
Computing snapshot kinetics for 6h...
Sampling from non-steady state for mESC.6h.dTag.120min.4sU.A,mESC.6h.dTag.120min.4sU.B,mESC.6h.dTag.120min.4sU.C (reference: mESC.4h.dTag.120min.4sU.A,mESC.4h.dTag.120min.4sU.B,mESC.4h.dTag.120min.4sU.C)...
Beta prior for mESC.6h.dTag.120min.4sU.A,mESC.6h.dTag.120min.4sU.B,mESC.6h.dTag.120min.4sU.C: a=2.417, b=15.200
Computing snapshot kinetics for 20h...
Sampling from non-steady state for mESC.20h.dTag.120min.4sU.A,mESC.20h.dTag.120min.4sU.B,mESC.20h.dTag.120min.4sU.C (reference: mESC.6h.dTag.120min.4sU.A,mESC.6h.dTag.120min.4sU.B,mESC.6h.dTag.120min.4sU.C)...
Beta prior for mESC.20h.dTag.120min.4sU.A,mESC.20h.dTag.120min.4sU.B,mESC.20h.dTag.120min.4sU.C: a=4.470, b=14.068Now we can obtain the analysis table after recalibration and plot the distributions of half-lives estimated from each timepoint:
df <- GetAnalysisTable(banp,analyses = "cMAP",by.rows = TRUE)
ggplot(df,aes(Analysis,HL))+
  geom_boxplot()+
  scale_y_log10()+
  coord_cartesian(ylim=c(0.3,24))
Warning: Transformation introduced infinite values in continuous y-axisWarning: Removed 215 rows containing non-finite values (stat_boxplot).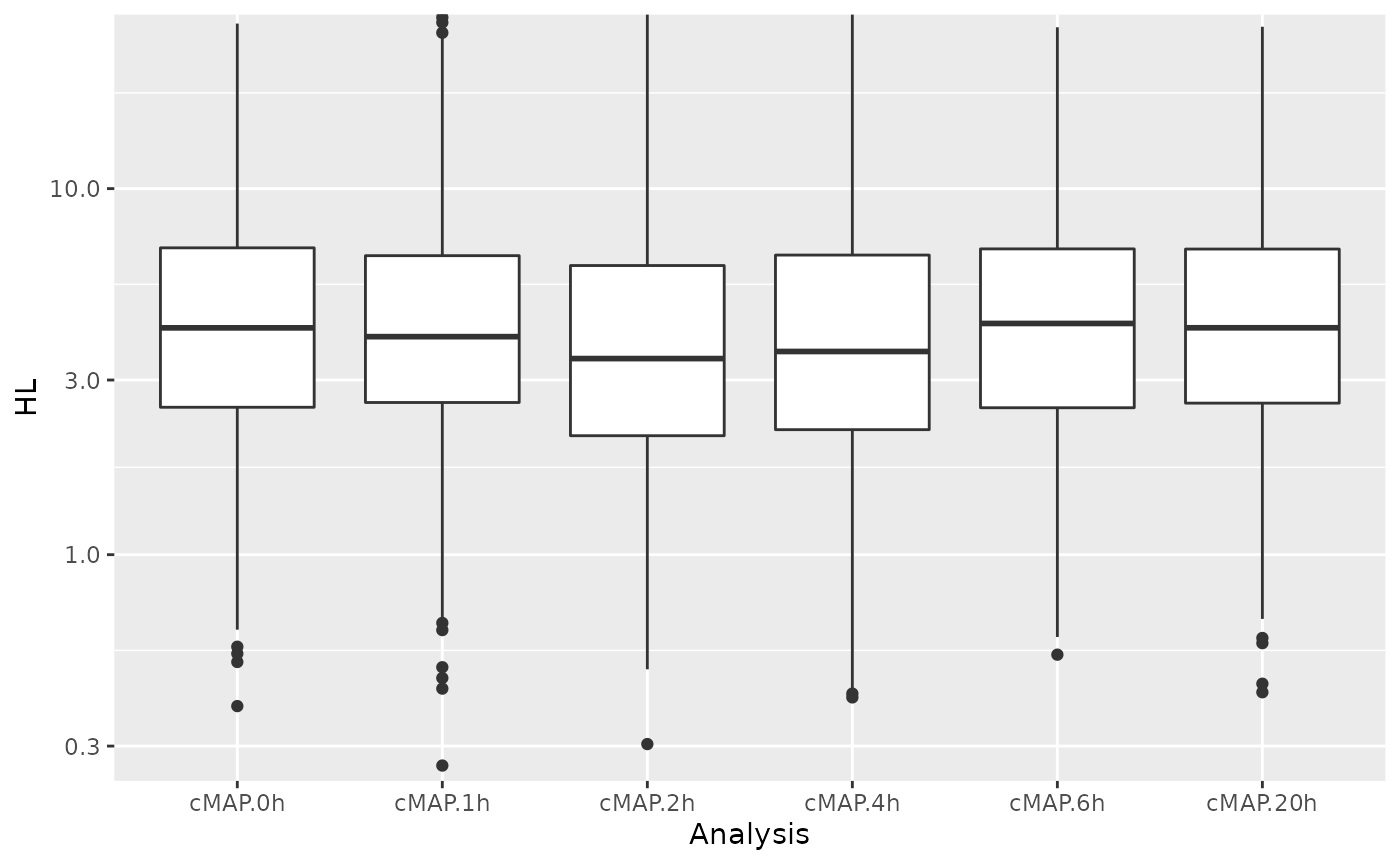
Now the distributions match much better. We can now go on and estimate log2 fold changes of synthesis and RNA half-lives. We again do not perform sampling from the posterior (N=0) which would take a long time:
banp <- EstimateRegulation(banp,"Regulation",
                           contrasts=contrasts,
                           reference.columns=reference.columns,
                           time.labeling = "calibrated_time",verbose=T,
                           time.experiment = "Experimental.time",correct.labeling=TRUE,
                           N=0)
Computing Regulation for 1h vs 0h...
Sampling from non-steady state for mESC.1h.dTag.30min.4sU.A,mESC.1h.dTag.30min.4sU.B,mESC.1h.dTag.30min.4sU.C (reference: mESC.0h.dTag.2h.4sU.A,mESC.0h.dTag.2h.4sU.B)...
Sampling from steady state for mESC.0h.dTag.2h.4sU.A,mESC.0h.dTag.2h.4sU.B...
Beta prior for mESC.1h.dTag.30min.4sU.A,mESC.1h.dTag.30min.4sU.B,mESC.1h.dTag.30min.4sU.C: a=4.656, b=31.514
Beta prior for mESC.0h.dTag.2h.4sU.A,mESC.0h.dTag.2h.4sU.B: a=4.742, b=31.936
Computing Regulation for 2h vs 0h...
Sampling from non-steady state for mESC.2h.dTag.90min.4sU.A,mESC.2h.dTag.90min.4sU.B,mESC.2h.dTag.90min.4sU.C (reference: mESC.1h.dTag.30min.4sU.A,mESC.1h.dTag.30min.4sU.B,mESC.1h.dTag.30min.4sU.C)...
Sampling from steady state for mESC.0h.dTag.2h.4sU.A,mESC.0h.dTag.2h.4sU.B...
Beta prior for mESC.2h.dTag.90min.4sU.A,mESC.2h.dTag.90min.4sU.B,mESC.2h.dTag.90min.4sU.C: a=7.277, b=20.915
Beta prior for mESC.0h.dTag.2h.4sU.A,mESC.0h.dTag.2h.4sU.B: a=4.742, b=31.936
Computing Regulation for 4h vs 0h...
Sampling from non-steady state for mESC.4h.dTag.120min.4sU.A,mESC.4h.dTag.120min.4sU.B,mESC.4h.dTag.120min.4sU.C (reference: mESC.2h.dTag.90min.4sU.A,mESC.2h.dTag.90min.4sU.B,mESC.2h.dTag.90min.4sU.C)...
Sampling from steady state for mESC.0h.dTag.2h.4sU.A,mESC.0h.dTag.2h.4sU.B...
Beta prior for mESC.4h.dTag.120min.4sU.A,mESC.4h.dTag.120min.4sU.B,mESC.4h.dTag.120min.4sU.C: a=12.671, b=32.000
Beta prior for mESC.0h.dTag.2h.4sU.A,mESC.0h.dTag.2h.4sU.B: a=4.742, b=31.936
Computing Regulation for 6h vs 0h...
Sampling from non-steady state for mESC.6h.dTag.120min.4sU.A,mESC.6h.dTag.120min.4sU.B,mESC.6h.dTag.120min.4sU.C (reference: mESC.4h.dTag.120min.4sU.A,mESC.4h.dTag.120min.4sU.B,mESC.4h.dTag.120min.4sU.C)...
Sampling from steady state for mESC.0h.dTag.2h.4sU.A,mESC.0h.dTag.2h.4sU.B...
Beta prior for mESC.6h.dTag.120min.4sU.A,mESC.6h.dTag.120min.4sU.B,mESC.6h.dTag.120min.4sU.C: a=2.417, b=15.200
Beta prior for mESC.0h.dTag.2h.4sU.A,mESC.0h.dTag.2h.4sU.B: a=4.742, b=31.936
Computing Regulation for 20h vs 0h...
Sampling from non-steady state for mESC.20h.dTag.120min.4sU.A,mESC.20h.dTag.120min.4sU.B,mESC.20h.dTag.120min.4sU.C (reference: mESC.6h.dTag.120min.4sU.A,mESC.6h.dTag.120min.4sU.B,mESC.6h.dTag.120min.4sU.C)...
Sampling from steady state for mESC.0h.dTag.2h.4sU.A,mESC.0h.dTag.2h.4sU.B...
Beta prior for mESC.20h.dTag.120min.4sU.A,mESC.20h.dTag.120min.4sU.B,mESC.20h.dTag.120min.4sU.C: a=4.470, b=14.068
Beta prior for mESC.0h.dTag.2h.4sU.A,mESC.0h.dTag.2h.4sU.B: a=4.742, b=31.936Now we can compare the estimated synthesis fold changes between the time points:
a<-PlotScatter(banp,x=`Regulation.1h vs 0h.s.log2FC`,y=`Regulation.2h vs 0h.s.log2FC`,
xlim=c(-3,3),ylim=c(-3,3),highlight = GeneInfo(banp,"BANP-Target")=="yes")+
geom_abline()
b<-PlotScatter(banp,x=`Regulation.2h vs 0h.s.log2FC`,y=`Regulation.4h vs 0h.s.log2FC`,
xlim=c(-3,3),ylim=c(-3,3),highlight = GeneInfo(banp,"BANP-Target")=="yes")+
geom_abline()
c<-PlotScatter(banp,x=`Regulation.4h vs 0h.s.log2FC`,y=`Regulation.6h vs 0h.s.log2FC`,
xlim=c(-3,3),ylim=c(-3,3),highlight = GeneInfo(banp,"BANP-Target")=="yes")+
geom_abline()
d<-PlotScatter(banp,x=`Regulation.6h vs 0h.s.log2FC`,y=`Regulation.20h vs 0h.s.log2FC`,
xlim=c(-3,3),ylim=c(-3,3),highlight = GeneInfo(banp,"BANP-Target")=="yes")+
geom_abline()
(a|b)/(c|d)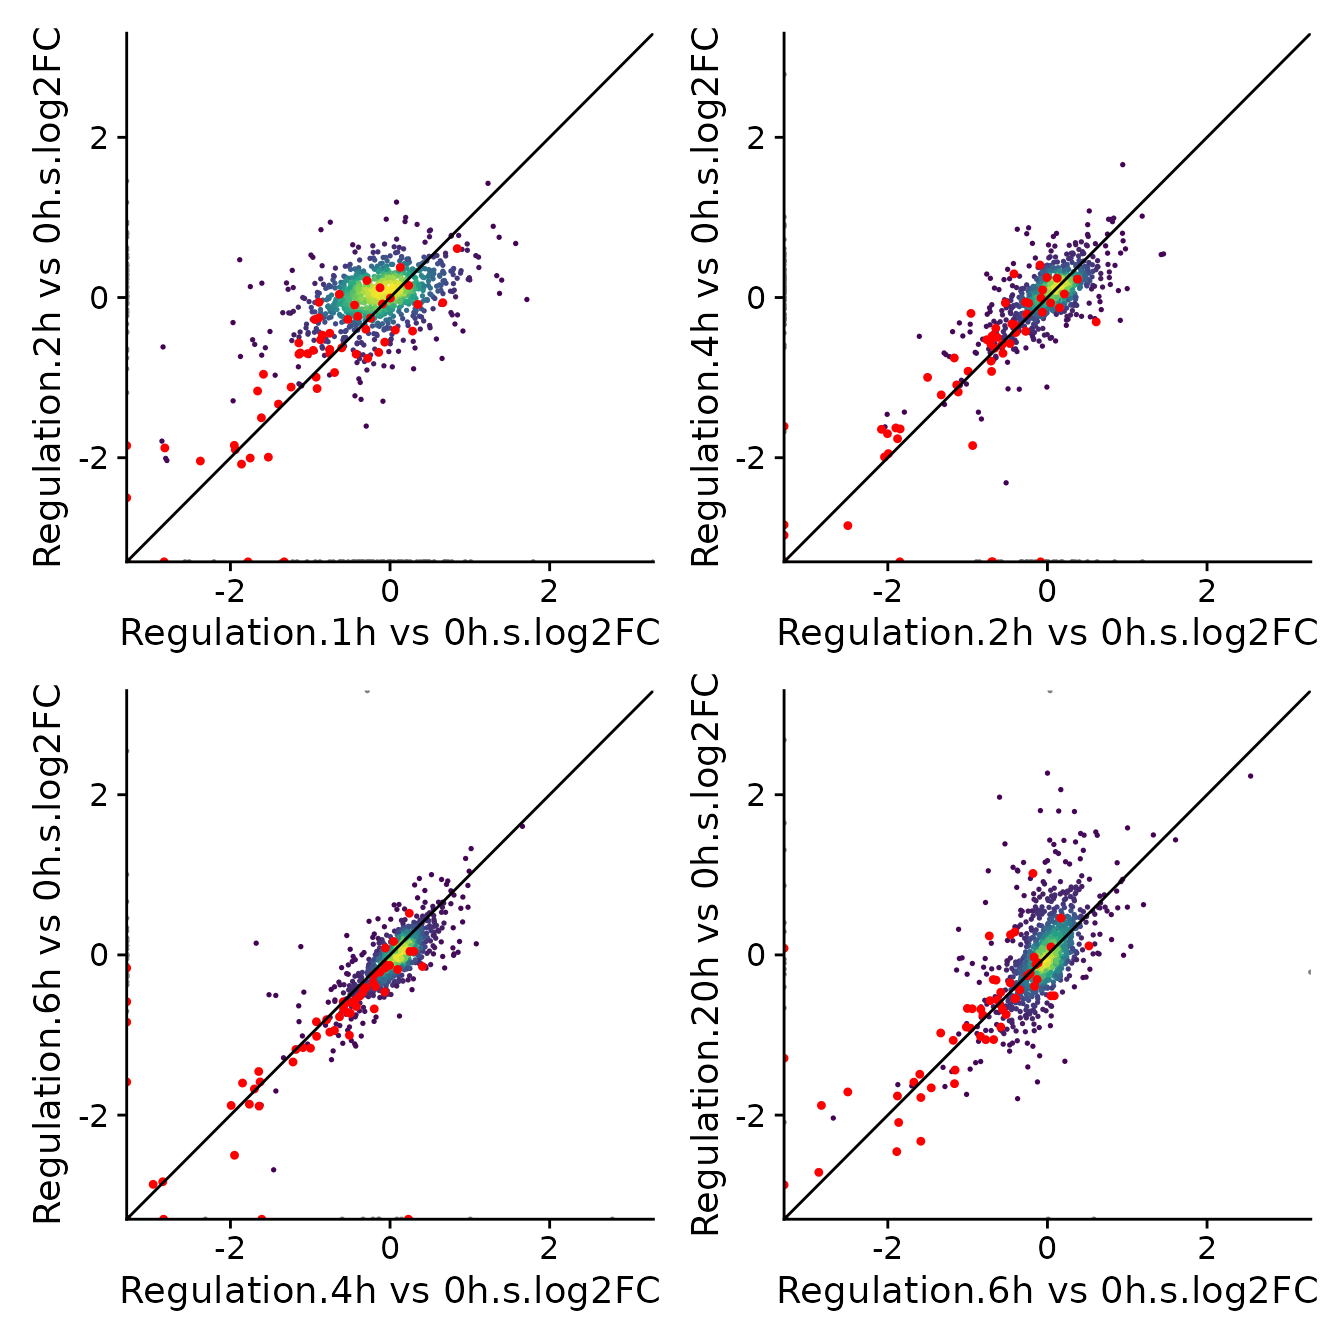 Note that for the first comparison (1h vs 0h against 2h vs 0h) most
genes do not scatter around the main diagonal, but the actual BANP
targets do. This suggests that there is a lot of noise w.r.t. the x axis
(which is not unexpected considering the short labeling time), but the
the estimation of synthesis rate fold changes is unbiased for genes that
actually change their synthesis rate.
Note that for the first comparison (1h vs 0h against 2h vs 0h) most
genes do not scatter around the main diagonal, but the actual BANP
targets do. This suggests that there is a lot of noise w.r.t. the x axis
(which is not unexpected considering the short labeling time), but the
the estimation of synthesis rate fold changes is unbiased for genes that
actually change their synthesis rate.